Разделы презентаций
- Разное
- Английский язык
- Астрономия
- Алгебра
- Биология
- География
- Геометрия
- Детские презентации
- Информатика
- История
- Литература
- Математика
- Медицина
- Менеджмент
- Музыка
- МХК
- Немецкий язык
- ОБЖ
- Обществознание
- Окружающий мир
- Педагогика
- Русский язык
- Технология
- Физика
- Философия
- Химия
- Шаблоны, картинки для презентаций
- Экология
- Экономика
- Юриспруденция
Dynamic Analysis of Team strategy in Professional Soccer
Содержание
- 1. Dynamic Analysis of Team strategy in Professional Soccer
- 2. Collaborators & contributorsDr. Mark Glickman Senior Lecturer,
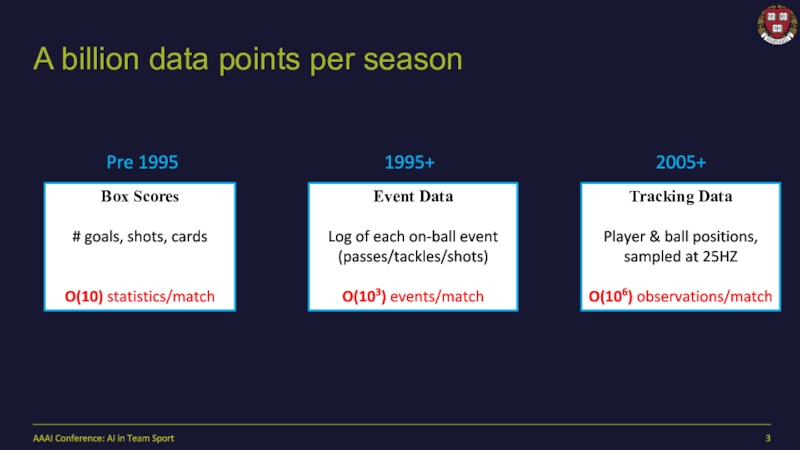
- 3. A billion data points per seasonAAAI Conference: AI in Team Sport
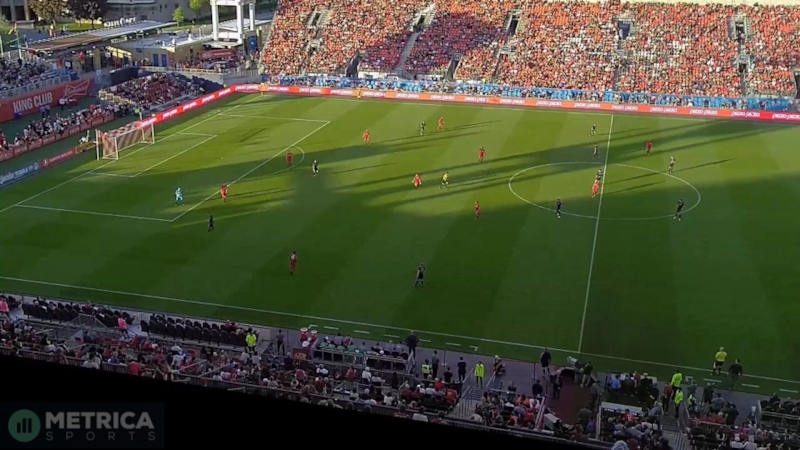
- 4. Nick DeLeon goal for Toronto vs Kansas CityAAAI Conference
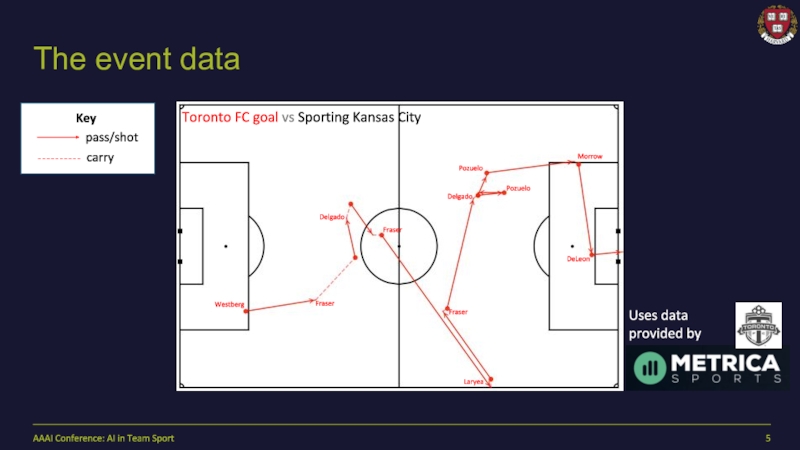
- 5. The event dataToronto FC goal vs Sporting
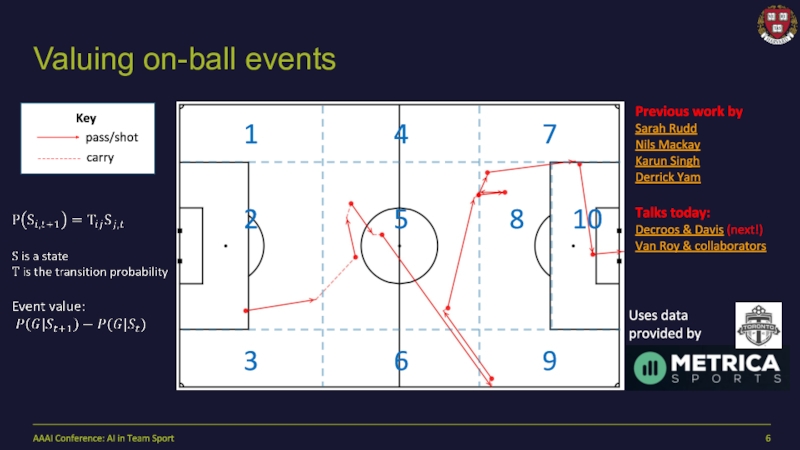
- 6. Previous work bySarah RuddNils MackayKarun SinghDerrick Yam
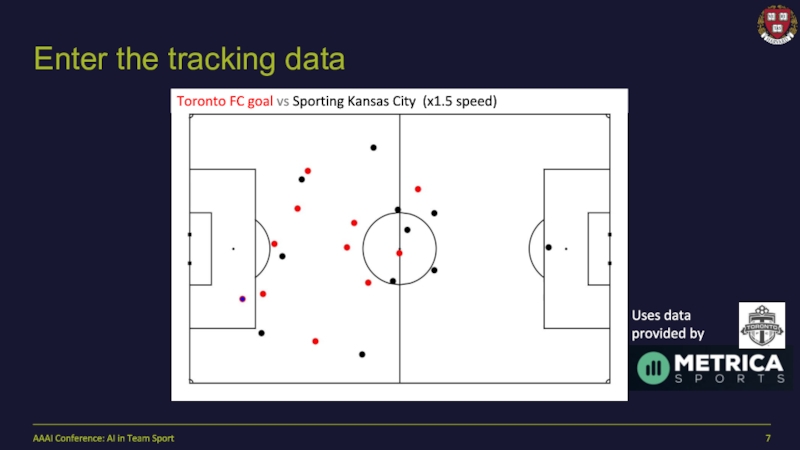
- 7. Enter the tracking dataToronto FC goal vs
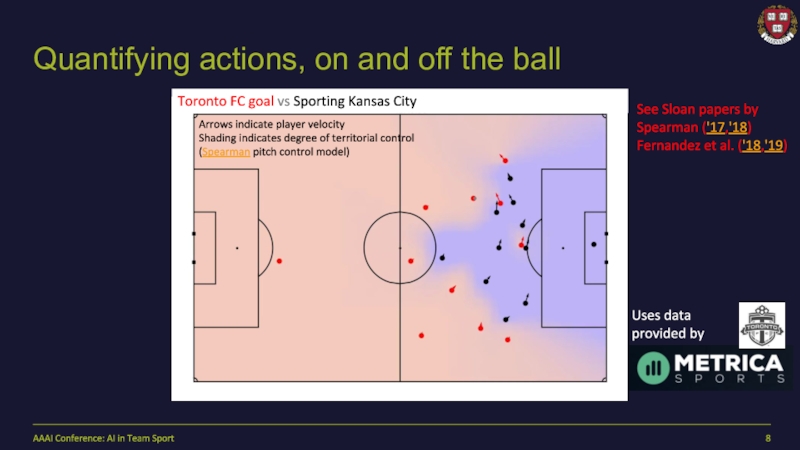
- 8. Arrows indicate player velocityShading indicates degree of
- 9. Part 2: Strategy and FormationPlayer motion is
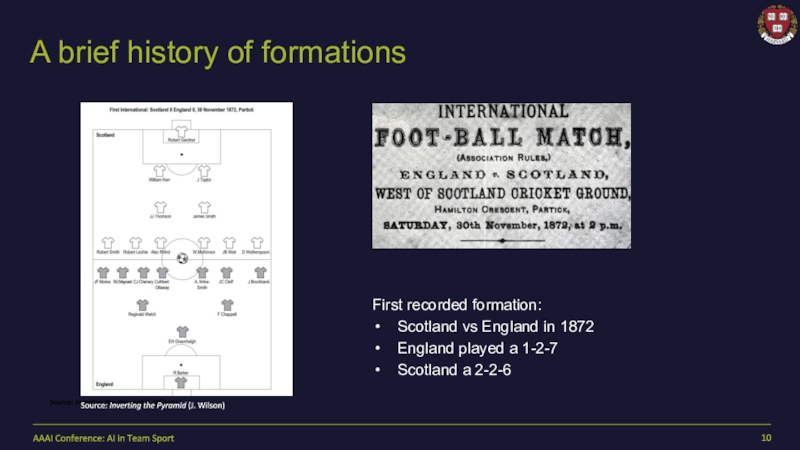
- 10. A brief history of formationsFirst recorded formation:Scotland
- 11. A brief history of formationsSource: Inverting the
- 12. Dynamic FormationsFour Objectives:Use tracking data to measure
- 13. Measuring formationsOutfield players move as a coherent
- 14. Measuring formationsInstantMeasure formation by calculating the vectors
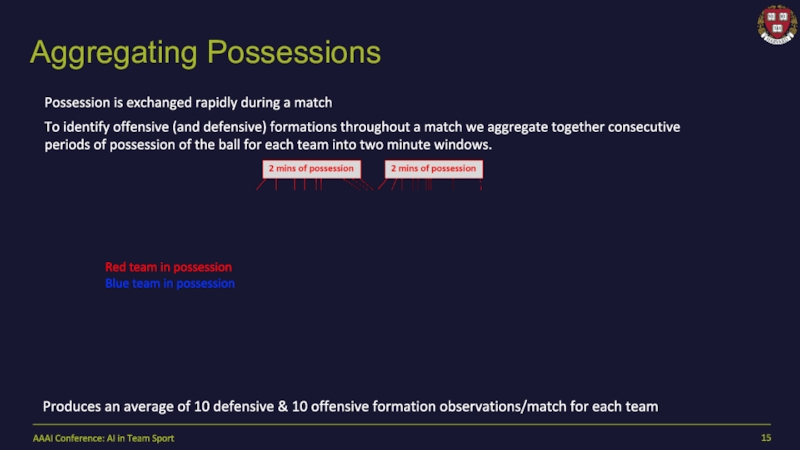
- 15. Aggregating PossessionsPossession is exchanged rapidly during a
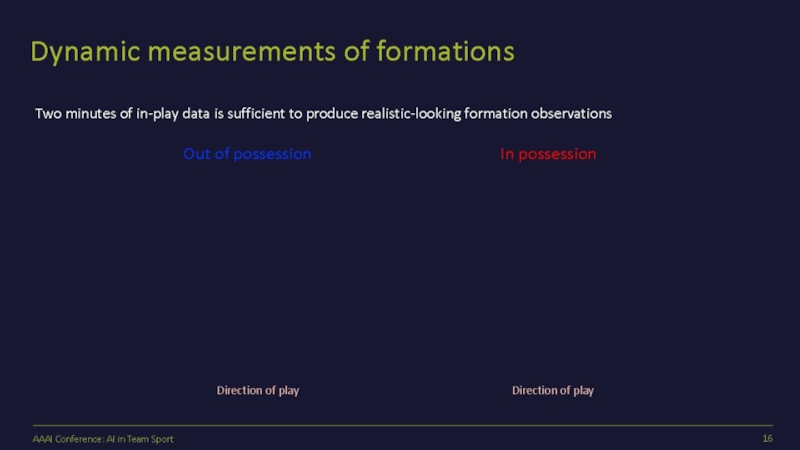
- 16. Dynamic measurements of formationsTwo minutes of in-play
- 17. Formation clusteringAAAI Conference: AI in Team Sport
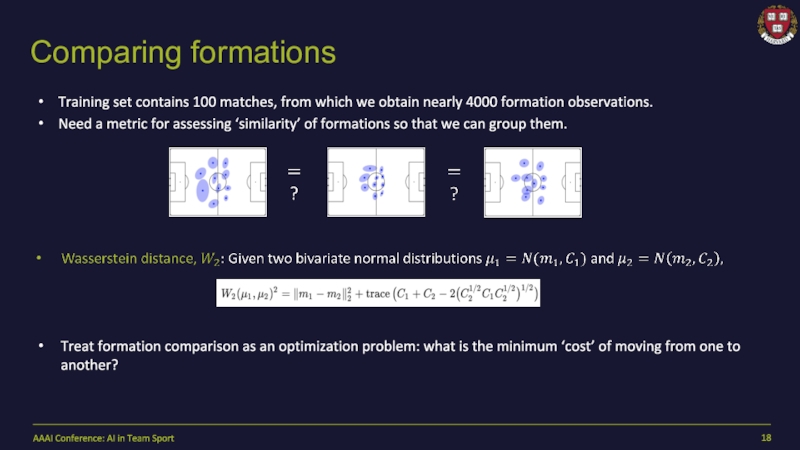
- 18. Comparing formationsTraining set contains 100 matches, from
- 19. The stretch parameter, kTwo formations can be
- 20. Hierarchical clusteringFind two most similar formation observations
- 21. Hierarchical clusteringGroup 1Group 2Group 3Group 4Group 5Hierarchical
- 22. Hierarchical clusteringGroup 1Clusters 1-417 % of sample5
- 23. Hierarchical clusteringGroup 2Clusters 5-817 % of sampleMixed
- 24. Hierarchical clusteringGroup 3Clusters 9-1236 % of sampleMajority defensiveAAAI Conference: AI in Team SportDirection of play
- 25. Hierarchical clusteringGroup 4Clusters 13-163 at the back11
- 26. Hierarchical clusteringGroup 5Clusters 17-202 at the back20
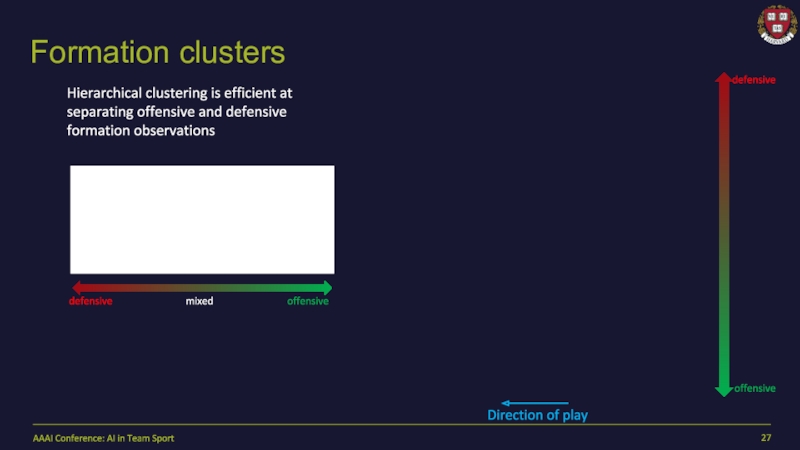
- 27. Formation clustersdefensiveoffensivemixedHierarchical clustering is efficient at separating
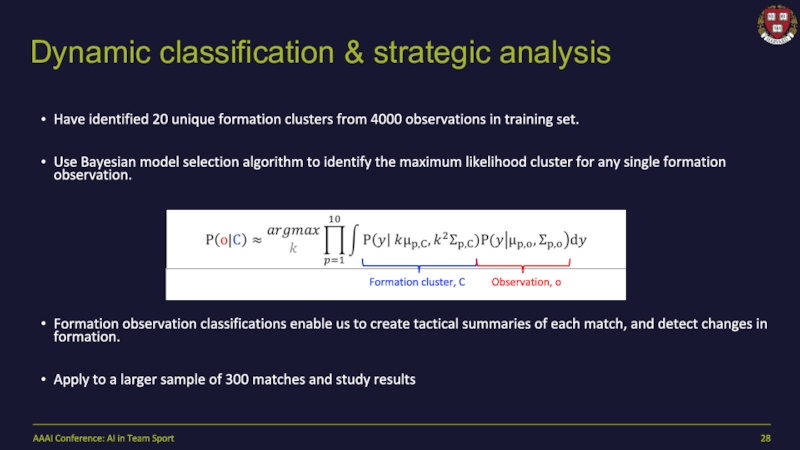
- 28. Have identified 20 unique formation clusters from
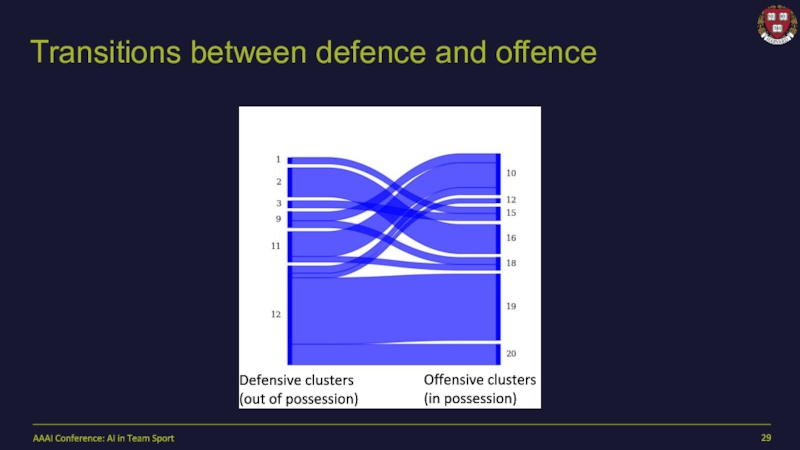
- 29. Transitions between defence and offenceDefensive clusters(out of possession)Offensive clusters(in possession)AAAI Conference: AI in Team Sport
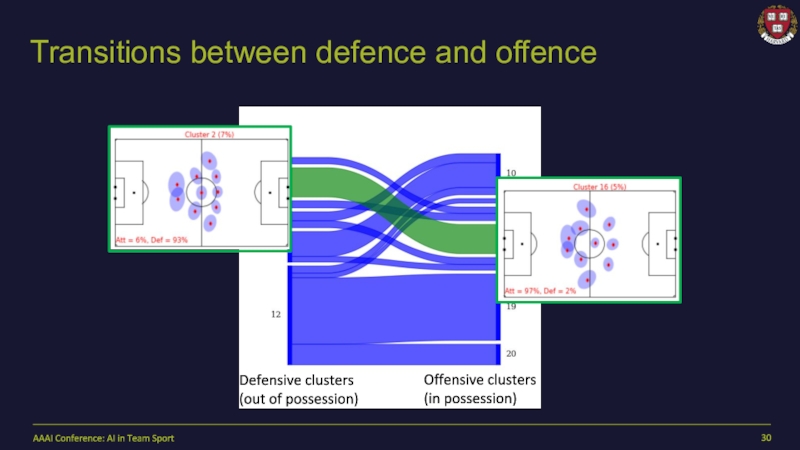
- 30. Transitions between defence and offenceDefensive clusters(out of
- 31. Transitions between defence and offenceDefensive clusters(out of
- 32. Strategic match summariesLines indicate substitutions Red team
- 33. Understanding tactical changesFirst halfRed Team defensive formationBlue Team pass/shot mapAAAI Conference: AI in Team Sport
- 34. Do formation changes affect match outcomes?Small sample
- 35. Linking chance creation and formation disruptionSpearman (2018)
- 36. SummaryPart 2Presented an algorithm for measuring and
- 37. Thanks!AAAI Conference: AI in Team Sport
- 38. Скачать презентанцию
Слайды и текст этой презентации
Слайд 1Dynamic Analysis of Team strategy in Professional Soccer
Laurie Shaw &
Mark Glickman, Harvard Sports Analytics Lab
SportСлайд 2Collaborators & contributors
Dr. Mark Glickman
Senior Lecturer, Harvard Department of
Statistics
Head of the Sports Analytics Lab
Devin Pleuler
Director, Analytics, Toronto
FCDr. Kenneth Cortsen: Asst. Professor of Sports Management , UC of North Denmark & Coach at Aalborg FC
Harvard Undergraduates: Andrew Puopolo & Jonathan Ma
Mike Treacy: Former Chairman of Dundalk FC
AAAI Conference: AI in Team Sport
Слайд 5The event data
Toronto FC goal vs Sporting Kansas City
Westberg
Fraser
Delgado
Fraser
Laryea
Fraser
Delgado
Pozuelo
Pozuelo
Morrow
DeLeon
AAAI Conference:
AI in Team Sport
Uses data provided by
Слайд 6Previous work by
Sarah Rudd
Nils Mackay
Karun Singh
Derrick Yam
Talks today:
Decroos &
Davis (next!)
Van Roy & collaborators
Valuing on-ball events
AAAI Conference: AI in
Team SportUses data provided by
Слайд 7Enter the tracking data
Toronto FC goal vs Sporting Kansas City
(x1.5 speed)
AAAI Conference: AI in Team Sport
Uses data provided by
Слайд 8Arrows indicate player velocity
Shading indicates degree of territorial control (Spearman
pitch control model)
Quantifying actions, on and off the ball
See
Sloan papers bySpearman ('17,'18)
Fernandez et al. ('18,'19)
Toronto FC goal vs Sporting Kansas City
AAAI Conference: AI in Team Sport
Uses data provided by
Слайд 9Part 2: Strategy and Formation
Player motion is strongly influenced by
the role they have been allocated within the team’s overall
strategy.To quantify the value of player decisions, we must understand the tactical framework within which they play.
A key element of strategy is team formation: the spatial distribution of players on the field.
AAAI Conference: AI in Team Sport
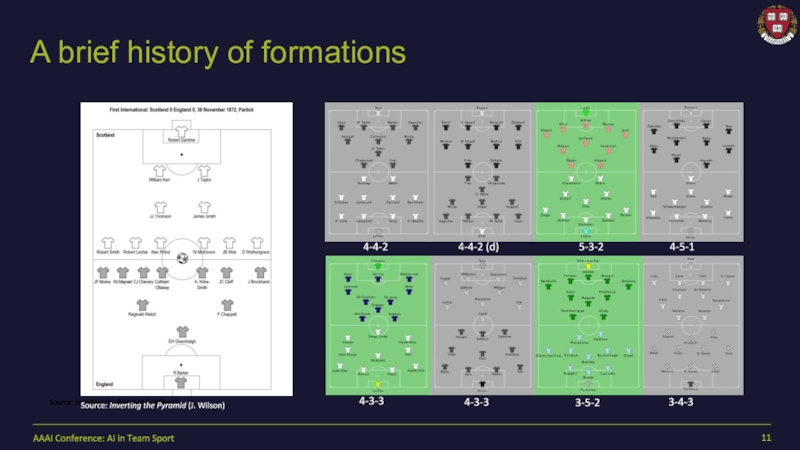
Слайд 10A brief history of formations
First recorded formation:
Scotland vs England in
1872
England played a 1-2-7
Scotland a 2-2-6
Source: Inverting the Pyramid
(J. Wilson)Source: Inverting the Pyramid (J. Wilson)
AAAI Conference: AI in Team Sport
Слайд 11A brief history of formations
Source: Inverting the Pyramid (J. Wilson)
4-4-2
(d)
4-4-2
5-3-2
4-3-3
4-3-3
3-5-2
4-5-1
3-4-3
Source: Inverting the Pyramid (J. Wilson)
AAAI Conference: AI in Team
SportСлайд 12Dynamic Formations
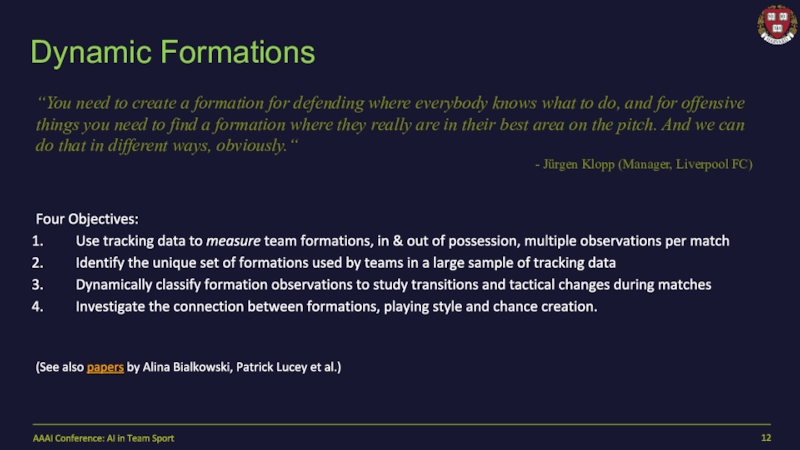
Four Objectives:
Use tracking data to measure team formations, in
& out of possession, multiple observations per match
Identify the unique
set of formations used by teams in a large sample of tracking dataDynamically classify formation observations to study transitions and tactical changes during matches
Investigate the connection between formations, playing style and chance creation.
(See also papers by Alina Bialkowski, Patrick Lucey et al.)
“You need to create a formation for defending where everybody knows what to do, and for offensive things you need to find a formation where they really are in their best area on the pitch. And we can do that in different ways, obviously.“
- Jürgen Klopp (Manager, Liverpool FC)
AAAI Conference: AI in Team Sport
Слайд 13Measuring formations
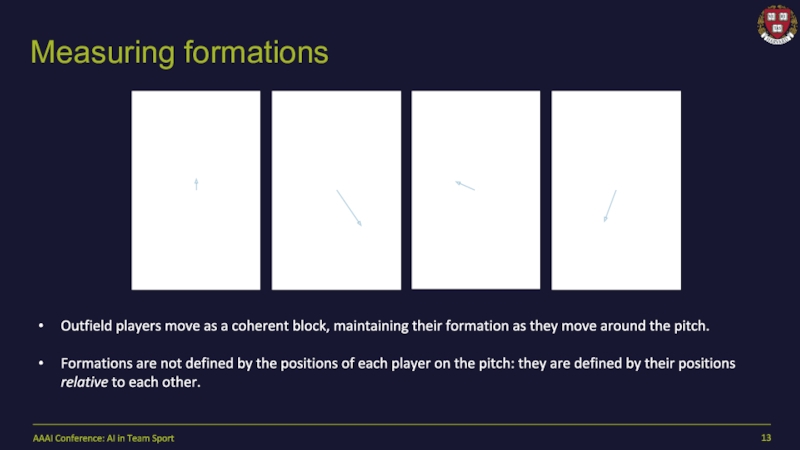
Outfield players move as a coherent block, maintaining their
formation as they move around the pitch.
Formations are not defined
by the positions of each player on the pitch: they are defined by their positions relative to each other.AAAI Conference: AI in Team Sport
Слайд 14Measuring formations
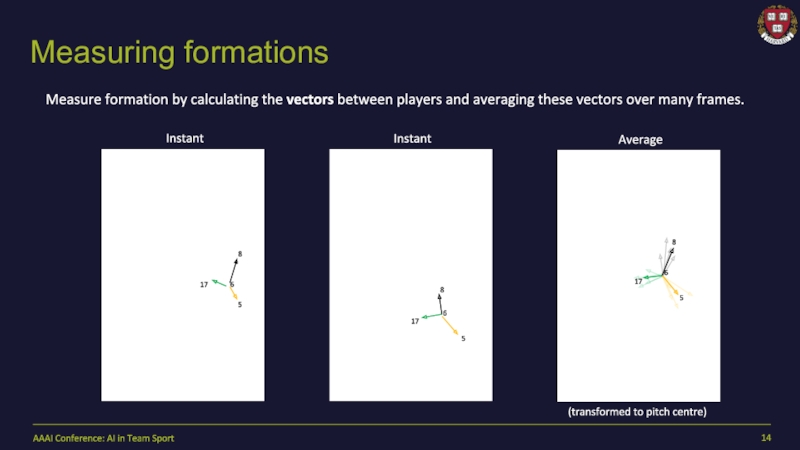
Instant
Measure formation by calculating the vectors between players and
averaging these vectors over many frames.
AAAI Conference: AI in Team
SportСлайд 15Aggregating Possessions
Possession is exchanged rapidly during a match
To identify
offensive (and defensive) formations throughout a match we aggregate together
consecutive periods of possession of the ball for each team into two minute windows.Produces an average of 10 defensive & 10 offensive formation observations/match for each team
Red team in possession
Blue team in possession
AAAI Conference: AI in Team Sport
Слайд 16Dynamic measurements of formations
Two minutes of in-play data is sufficient
to produce realistic-looking formation observations
Direction of play
Direction of play
In possession
Out
of possessionAAAI Conference: AI in Team Sport
Слайд 18Comparing formations
Training set contains 100 matches, from which we obtain
nearly 4000 formation observations.
Need a metric for assessing ‘similarity’ of
formations so that we can group them.AAAI Conference: AI in Team Sport
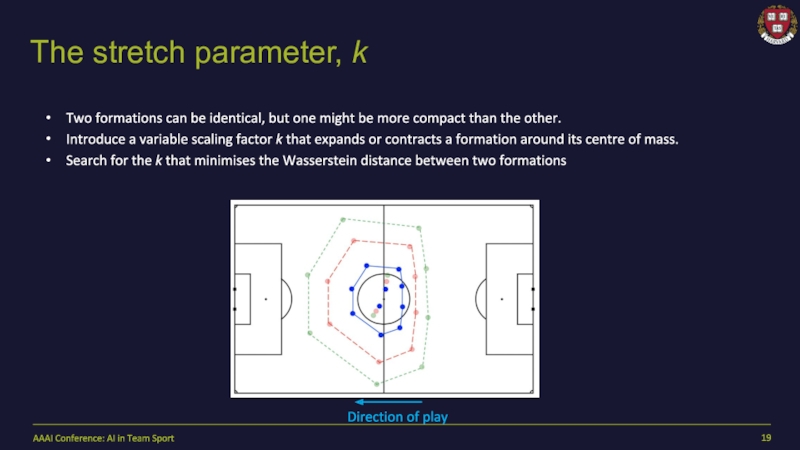
Слайд 19The stretch parameter, k
Two formations can be identical, but one
might be more compact than the other.
Introduce a variable
scaling factor k that expands or contracts a formation around its centre of mass. Search for the k that minimises the Wasserstein distance between two formations
AAAI Conference: AI in Team Sport
Direction of play
Слайд 20Hierarchical clustering
Find two most similar formation observations and combine to
form a group.
Find next two most most similar, and so
on.Eventually begin to combine groups, building up a hierarchy.
AAAI Conference: AI in Team Sport
Слайд 21Hierarchical clustering
Group 1
Group 2
Group 3
Group 4
Group 5
Hierarchical clustering indicates 5
groups of formations
Visual inspection indicates that, within each group, there
are 4 variants.Produces a total of 20 unique formation clusters.
AAAI Conference: AI in Team Sport
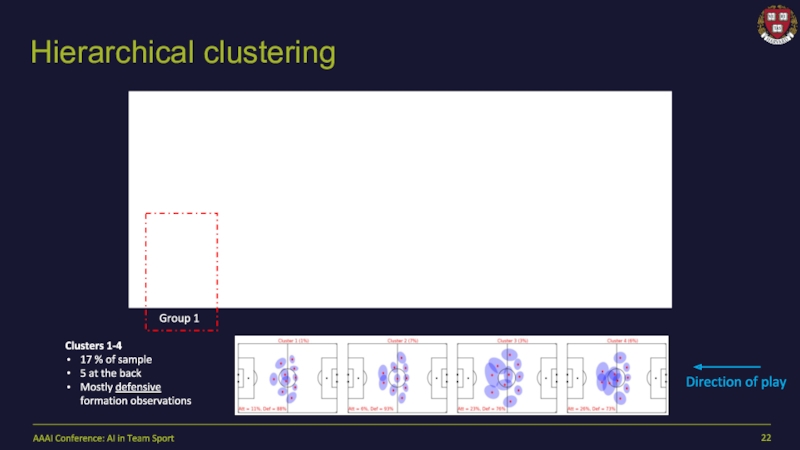
Слайд 22Hierarchical clustering
Group 1
Clusters 1-4
17 % of sample
5 at the back
Mostly
defensive formation observations
AAAI Conference: AI in Team Sport
Direction of play
Слайд 23Hierarchical clustering
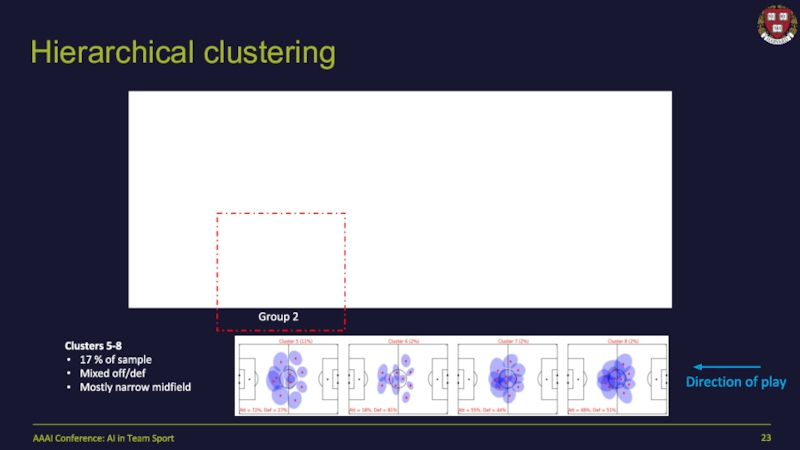
Group 2
Clusters 5-8
17 % of sample
Mixed off/def
Mostly narrow midfield
AAAI
Conference: AI in Team Sport
Direction of play
Слайд 24Hierarchical clustering
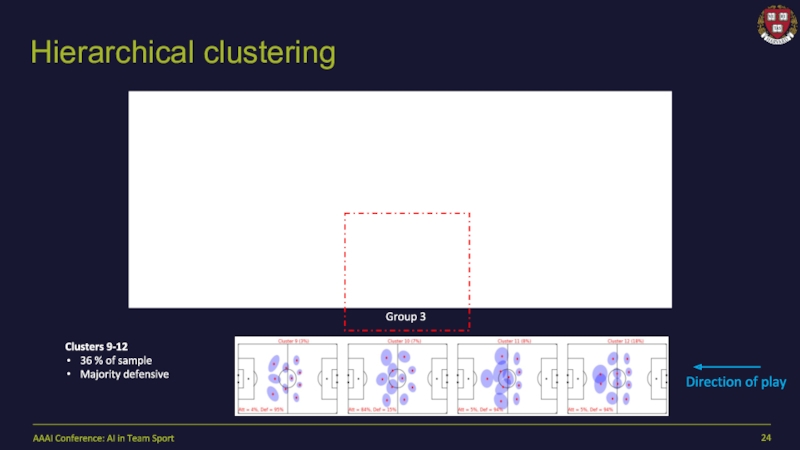
Group 3
Clusters 9-12
36 % of sample
Majority defensive
AAAI Conference: AI
in Team Sport
Direction of play
Слайд 25Hierarchical clustering
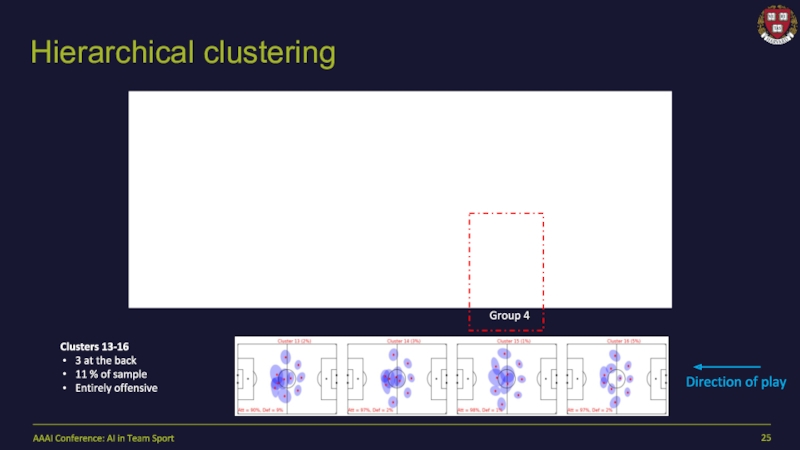
Group 4
Clusters 13-16
3 at the back
11 % of sample
Entirely
offensive
AAAI Conference: AI in Team Sport
Direction of play
Слайд 26Hierarchical clustering
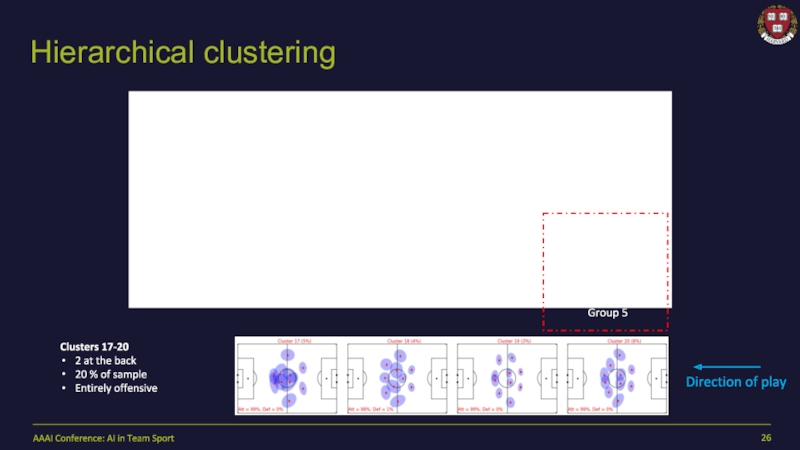
Group 5
Clusters 17-20
2 at the back
20 % of sample
Entirely
offensive
AAAI Conference: AI in Team Sport
Direction of play
Слайд 27Formation clusters
defensive
offensive
mixed
Hierarchical clustering is efficient at separating offensive and defensive
formation observations
defensive
offensive
AAAI Conference: AI in Team Sport
Direction of play
Слайд 28Have identified 20 unique formation clusters from 4000 observations in
training set.
Use Bayesian model selection algorithm to identify the maximum
likelihood cluster for any single formation observation.Formation observation classifications enable us to create tactical summaries of each match, and detect changes in formation.
Apply to a larger sample of 300 matches and study results
AAAI Conference: AI in Team Sport
Dynamic classification & strategic analysis
Слайд 29Transitions between defence and offence
Defensive clusters
(out of possession)
Offensive clusters
(in possession)
AAAI
Conference: AI in Team Sport
Слайд 30Transitions between defence and offence
Defensive clusters
(out of possession)
Offensive clusters
(in possession)
AAAI
Conference: AI in Team Sport
Defensive clusters
(out of possession)
Offensive clusters
(in possession)
Слайд 31Transitions between defence and offence
Defensive clusters
(out of possession)
Offensive clusters
(in possession)
AAAI
Conference: AI in Team Sport
Defensive clusters
(out of possession)
Offensive clusters
(in possession)
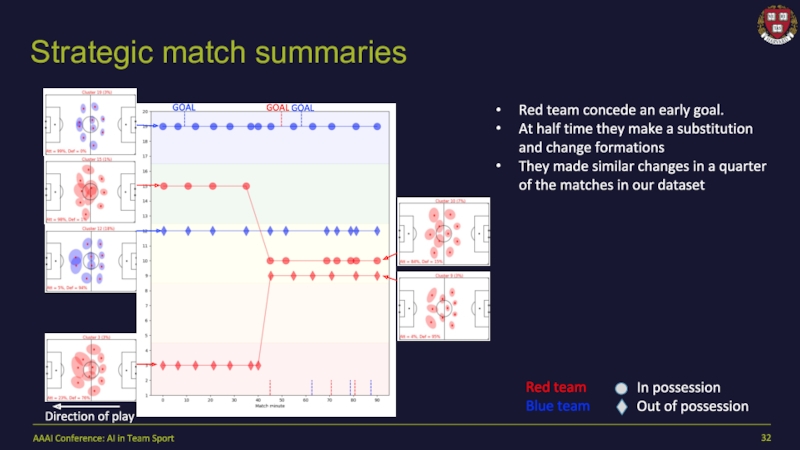
Слайд 32Strategic match summaries
Lines indicate substitutions
Red team concede an early
goal.
At half time they make a substitution and change
formationsThey made similar changes in a quarter of the matches in our dataset
Red team
Blue team
In possession
Out of possession
Lines indicate substitutions
GOAL
GOAL
GOAL
AAAI Conference: AI in Team Sport
Direction of play
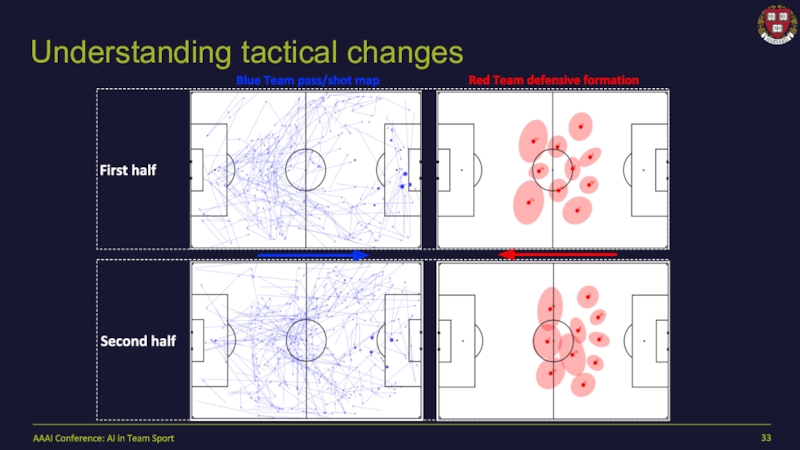
Слайд 33Understanding tactical changes
First half
Red Team defensive formation
Blue Team pass/shot map
AAAI
Conference: AI in Team Sport
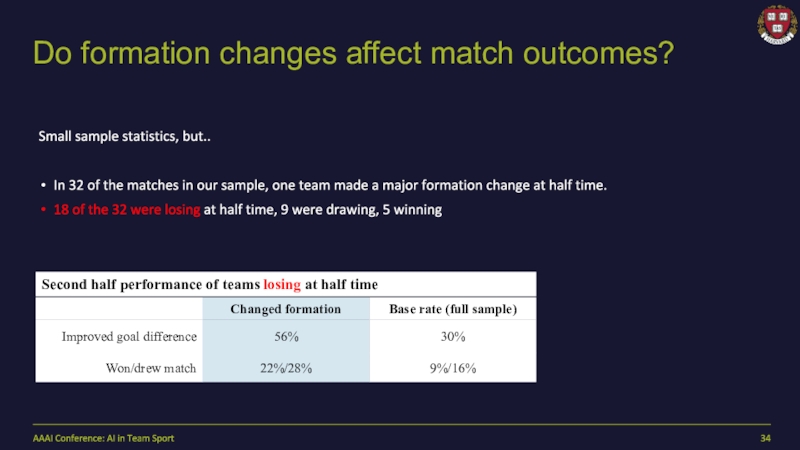
Слайд 34Do formation changes affect match outcomes?
Small sample statistics, but..
In 32
of the matches in our sample, one team made a
major formation change at half time.18 of the 32 were losing at half time, 9 were drawing, 5 winning
Second half performance of teams losing at half time
AAAI Conference: AI in Team Sport
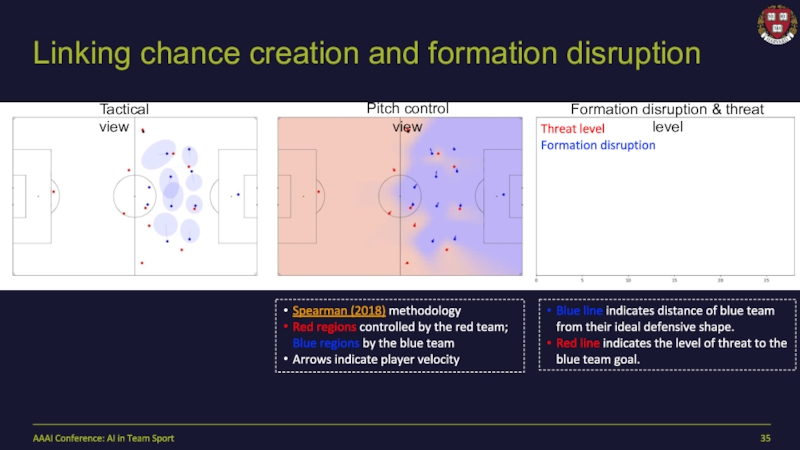
Слайд 35Linking chance creation and formation disruption
Spearman (2018) methodology
Red regions controlled
by the red team; Blue regions by the blue team
Arrows
indicate player velocityBlue line indicates distance of blue team from their ideal defensive shape.
Red line indicates the level of threat to the blue team goal.
Tactical view
Pitch control view
Formation disruption & threat level
Threat level
Formation disruption
AAAI Conference: AI in Team Sport
Слайд 36Summary
Part 2
Presented an algorithm for measuring and classifying team formations
throughout a match.
Dynamically detected changes in formations and explored their
impact on match outcome.Studied transitions between different defensive and offensive formations.
Initial work towards investigating the link between chance creation and formation disruption.
AAAI Conference: AI in Team Sport
Part 1
Review of previous work valuing individual player actions using event and tracking data.
Highlighted importance of quantifying off-the-ball motion


