Разделы презентаций
- Разное
- Английский язык
- Астрономия
- Алгебра
- Биология
- География
- Геометрия
- Детские презентации
- Информатика
- История
- Литература
- Математика
- Медицина
- Менеджмент
- Музыка
- МХК
- Немецкий язык
- ОБЖ
- Обществознание
- Окружающий мир
- Педагогика
- Русский язык
- Технология
- Физика
- Философия
- Химия
- Шаблоны, картинки для презентаций
- Экология
- Экономика
- Юриспруденция
Extending the Analysis of Aggregate Supply
Содержание
- 1. Extending the Analysis of Aggregate Supply
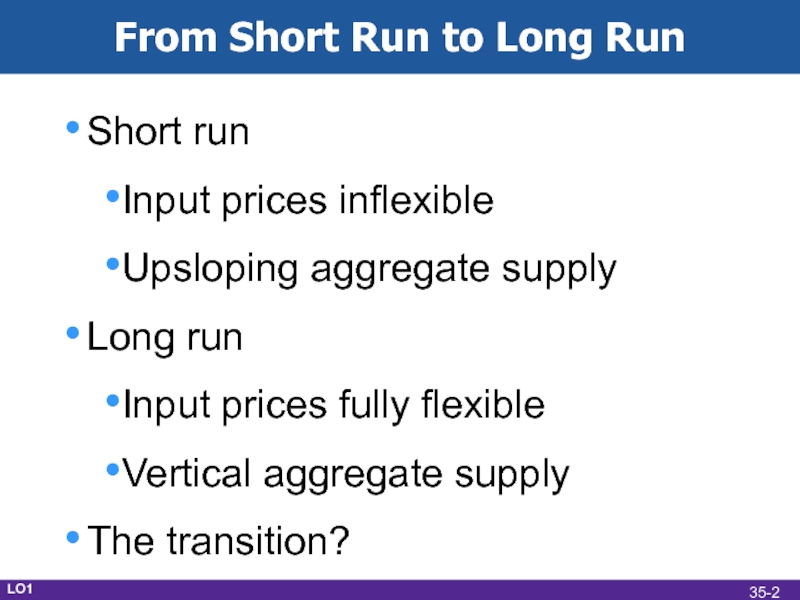
- 2. From Short Run to Long RunShort runInput
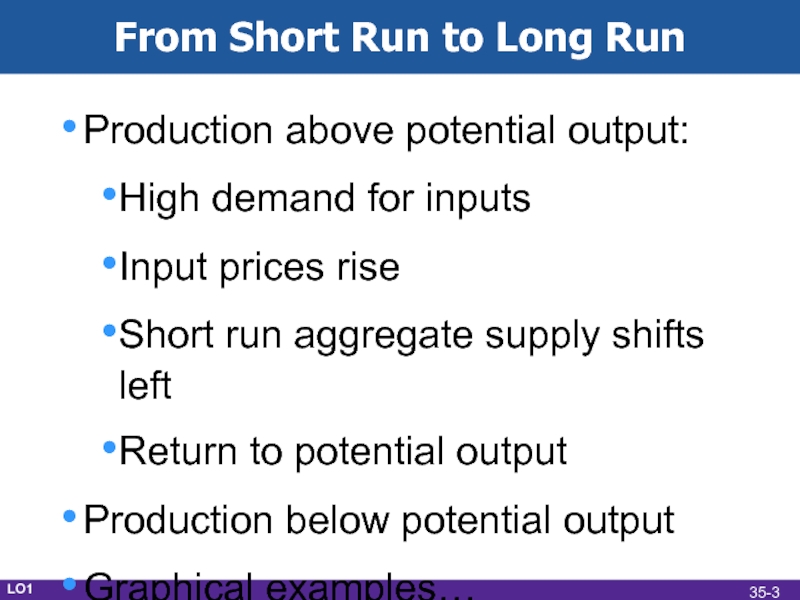
- 3. From Short Run to Long RunProduction above
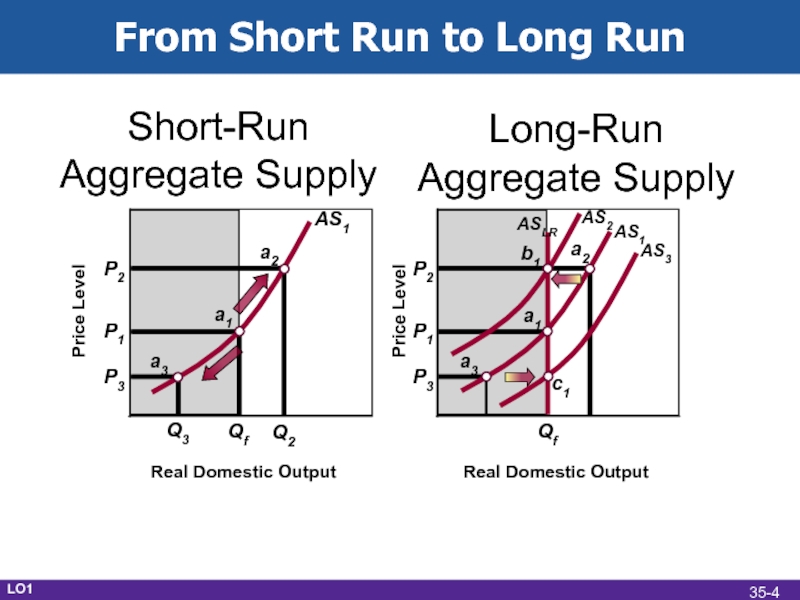
- 4. From Short Run to Long RunP3P1P2P3P1P2Real Domestic OutputReal Domestic OutputQfShort-RunAggregate SupplyLong-RunAggregate Supplya1a2a3b1c1Price LevelPrice LevelAS3AS2AS1ASLRQfQ2Q3AS1a1a2a3LO135-
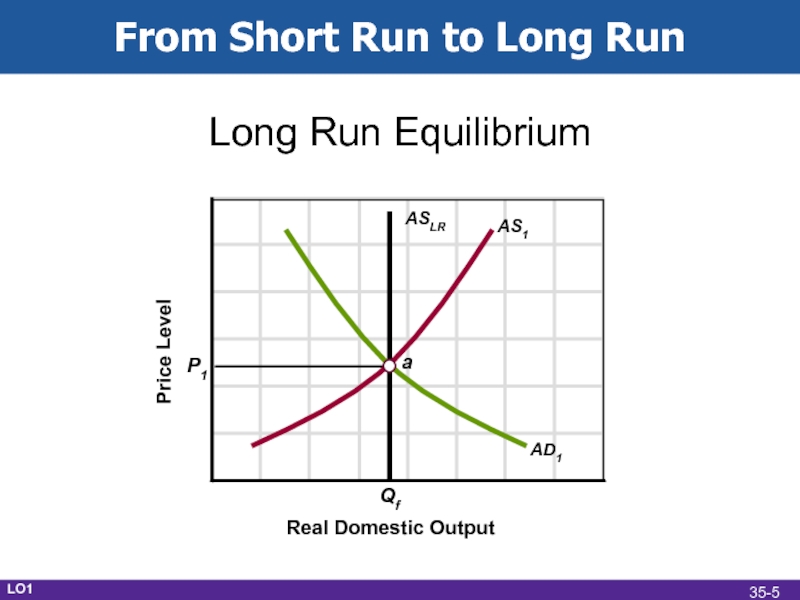
- 5. From Short Run to Long RunReal Domestic OutputLong Run EquilibriumPrice LevelP1QfaAS1ASLRAD1LO135-
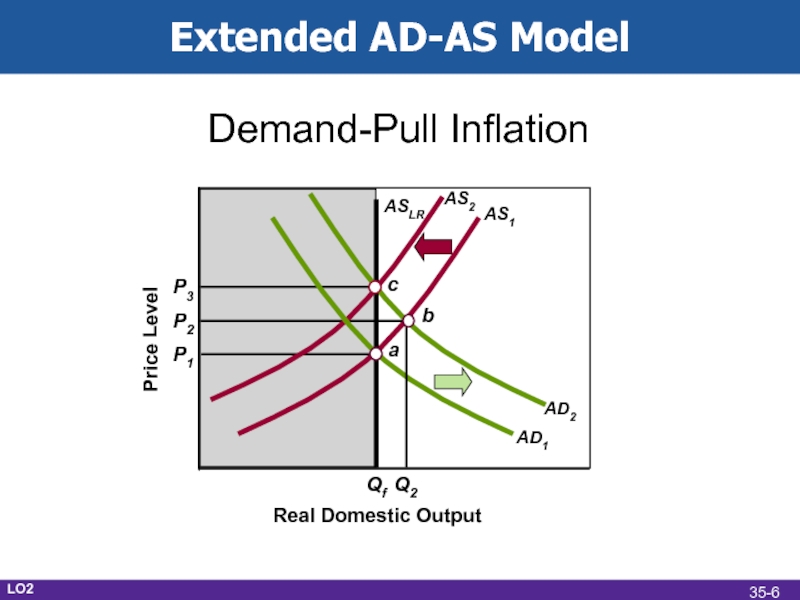
- 6. Extended AD-AS ModelReal Domestic OutputDemand-Pull Inflation Price LevelP1QfaAS1ASLRAD1AD2AS2cbP2P3Q2LO235-
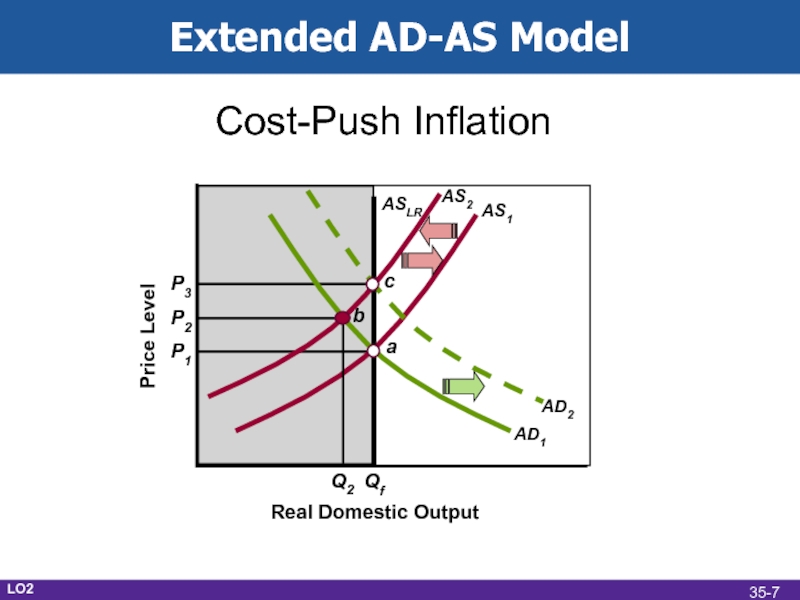
- 7. Extended AD-AS ModelReal Domestic OutputCost-Push Inflation Price LevelP1QfaAS1ASLRAD1AD2AS2bcP2P3Q2LO235-
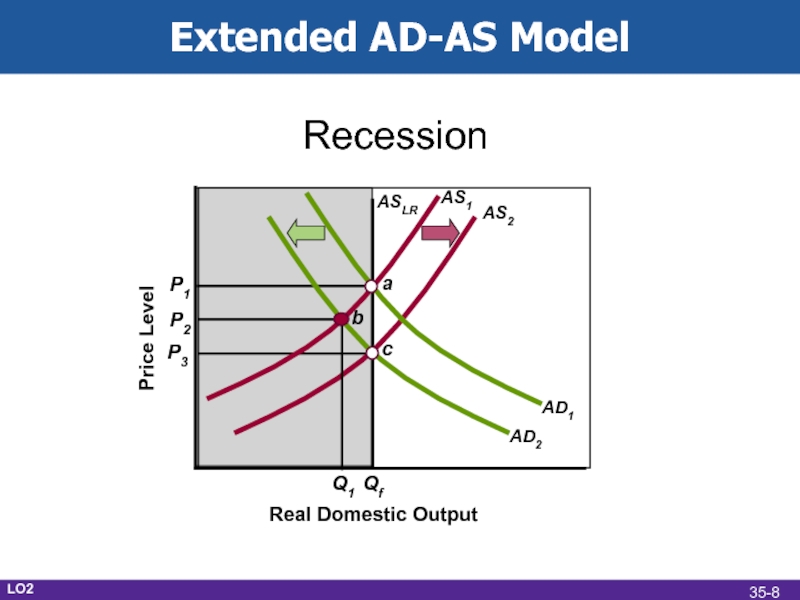
- 8. Extended AD-AS ModelReal Domestic OutputRecessionPrice LevelP1QfaAS1ASLRAD1AD2AS2bcP2P3Q1LO235-
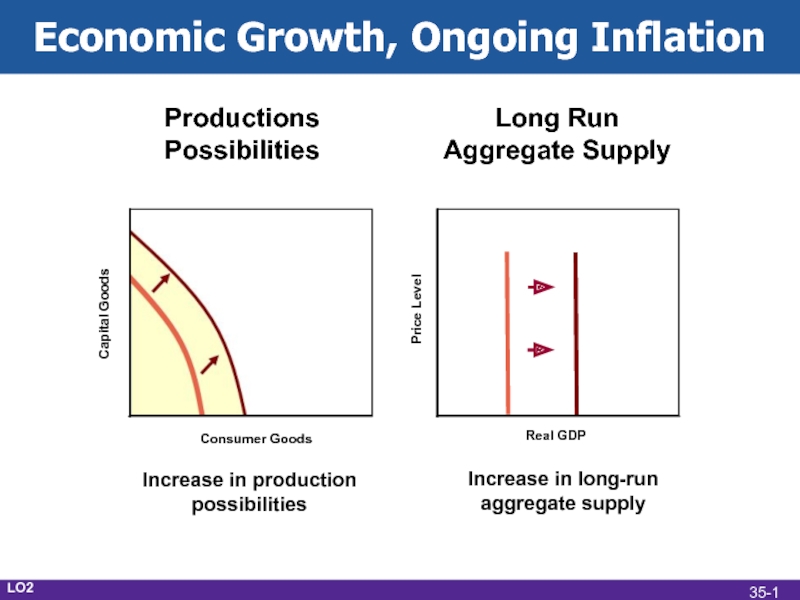
- 9. Extended AD-AS ModelExplaining ongoing inflationOngoing economic growth
- 10. Price LevelReal GDPCapital GoodsConsumer GoodsEconomic Growth, Ongoing
- 11. Inflation and UnemploymentLow inflation and unemploymentFed’s major
- 12. 1960s economists believed in stable, predictable tradeoffPhillips
- 13. Alban William Phillips
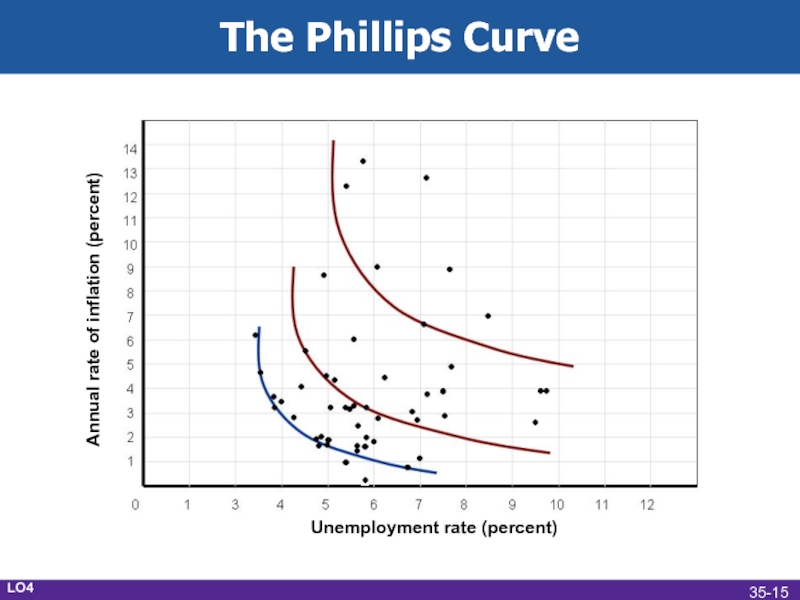
- 14. The Phillips CurveNo long-run tradeoff between inflation
- 15. The Phillips CurveLO41413121110987654321Annual rate of inflation (percent)Unemployment rate (percent)35-
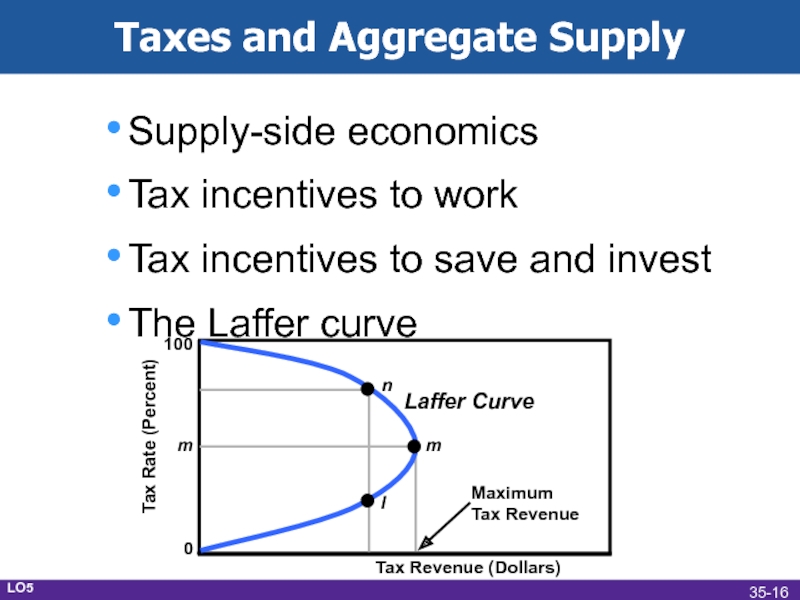
- 16. Taxes and Aggregate SupplySupply-side economicsTax incentives to
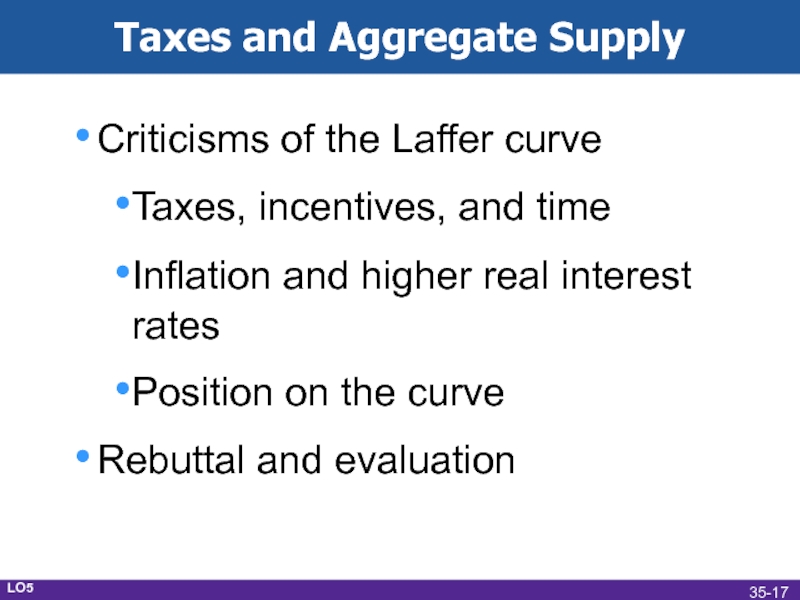
- 17. Taxes and Aggregate SupplyCriticisms of the Laffer
- 18. Скачать презентанцию
From Short Run to Long RunShort runInput prices inflexibleUpsloping aggregate supplyLong runInput prices fully flexibleVertical aggregate supplyThe transition?LO135-
Слайды и текст этой презентации
Слайд 1Extending the Analysis of Aggregate Supply
McGraw-Hill/Irwin
Copyright
© 2012 by The McGraw-Hill Companies, Inc. All rights reserved.
Слайд 2From Short Run to Long Run
Short run
Input prices inflexible
Upsloping aggregate
supply
Long run
Input prices fully flexible
Vertical aggregate supply
The transition?
LO1
35-
Слайд 3From Short Run to Long Run
Production above potential output:
High demand
for inputs
Input prices rise
Short run aggregate supply shifts left
Return to
potential outputProduction below potential output
Graphical examples…
LO1
35-
Слайд 4From Short Run to Long Run
P3
P1
P2
P3
P1
P2
Real Domestic Output
Real Domestic Output
Qf
Short-Run
Aggregate
Supply
Long-Run
Aggregate Supply
a1
a2
a3
b1
c1
Price Level
Price Level
AS3
AS2
AS1
ASLR
Qf
Q2
Q3
AS1
a1
a2
a3
LO1
35-
Слайд 5From Short Run to Long Run
Real Domestic Output
Long Run Equilibrium
Price
Level
P1
Qf
a
AS1
ASLR
AD1
LO1
35-
Слайд 6Extended AD-AS Model
Real Domestic Output
Demand-Pull Inflation
Price Level
P1
Qf
a
AS1
ASLR
AD1
AD2
AS2
c
b
P2
P3
Q2
LO2
35-
Слайд 7Extended AD-AS Model
Real Domestic Output
Cost-Push Inflation
Price Level
P1
Qf
a
AS1
ASLR
AD1
AD2
AS2
b
c
P2
P3
Q2
LO2
35-
Слайд 8Extended AD-AS Model
Real Domestic Output
Recession
Price Level
P1
Qf
a
AS1
ASLR
AD1
AD2
AS2
b
c
P2
P3
Q1
LO2
35-
Слайд 9Extended AD-AS Model
Explaining ongoing inflation
Ongoing economic growth shifts aggregate supply
Ongoing increases in money supply shift aggregate demand
Small positive
rate of inflationLO2
35-
Слайд 10Price Level
Real GDP
Capital Goods
Consumer Goods
Economic Growth, Ongoing Inflation
Productions Possibilities
Long Run
Aggregate Supply
Increase in production possibilities
Increase in long-run aggregate supply
LO2
35-
Слайд 11Inflation and Unemployment
Low inflation and unemployment
Fed’s major goals
Compatible or conflicting?
Short-run
tradeoff
Supply shocks cause both rates to rise
No long-run tradeoff
LO3
35-
Слайд 121960s economists believed in stable, predictable tradeoff
Phillips curve shifts over
time
Adverse supply shocks 1970s
OPEC oil price shock
Stagflation
Stagflation’s demise 1980s
The Phillips
CurveLO3
35-
Слайд 14The Phillips Curve
No long-run tradeoff between inflation and unemployment
Short-run Phillips
curve
Role of expected inflation
Long-run vertical Phillips curve
Disinflation (increase the purchasing
power of the local currency that is shown in the reduction of the price index)LO4
35-
Слайд 15The Phillips Curve
LO4
14
13
12
11
10
9
8
7
6
5
4
3
2
1
Annual rate of inflation (percent)
Unemployment rate (percent)
35-
Слайд 16Taxes and Aggregate Supply
Supply-side economics
Tax incentives to work
Tax incentives to
save and invest
The Laffer curve
Tax Rate (Percent)
Tax Revenue (Dollars)
100
m
0
n
l
m
Laffer Curve
Maximum
Tax
RevenueLO5
35-
Слайд 17Taxes and Aggregate Supply
Criticisms of the Laffer curve
Taxes, incentives, and
time
Inflation and higher real interest rates
Position on the curve
Rebuttal and
evaluationLO5
35-
