Слайд 1
Lecture 2
Methods in political science
Слайд 2Some basic concepts
Research method: A way of approaching the collection
and analysis of information, of identifying relationships between factors, and
ultimately of testing whether a theoretical proposition is true or false.
Variable: A concept that can have different values. The role of the variable depends on the theory.
Independent variable (predictor): A variable framing the causal phenomenon of a causal theory or hypothesis. The variable that affects/determines the outcome.
Dependent (outcome) variable: A variable framing the caused phenomenon of a causal theory or hypothesis. The variable that is affected/determined by the independent variable(s).
Hypothesis: A theory-based statement about a relationship that we expect to observe.
Null hypothesis: A hypothesis about what we would observe if there were no relationship between independent and the dependent variable.
Слайд 3From causal theory to hypothesis
Independent variable (concept)
Dependent variable (concept)
Causal theory
(Operationalization) (Operationalization)
Hypothesis
Independent variable (measured) Dependent variable (measured)
Слайд 4Case studies
A case study is “an intensive study of a
single unit for the purpose of understanding a larger class
of (similar) units” (Gerring 2004, p. 342).
There are several types of case studies:
Theory-generating case study: Offering an explanation for a particular phenomenon through a case, which can then be tested by observing other related cases.
Theory-testing case study: Taking an existing theoretical idea in political science and testing the theory by closely studying one particular case.
Critical case: A case where the theory is meant to hold.
Outlier case: A case for understanding why the theory does not hold.
Слайд 5Case studies
An event can be a case of many things.
(e.g. The Velvet revolutions) However, all the cases in a
given study must be instances of only one phenomenon.
e.g. In a study about civil war, would Turkey (the Kurdish question), Syria (the ongoing conflict), Sierra Leone (1991-2002) and United States (civil war North vs. South) be good cases to compare?
Process-tracing: Mapping the precise pathway from one variable to another variable, to try to uncover the causal mechanisms and sequences that explain how one variable has an effect on the other variable.
Слайд 6Comparative method
John Stuart Mill’s methods of agreement and difference can
be used to eliminate rival causal explanations.
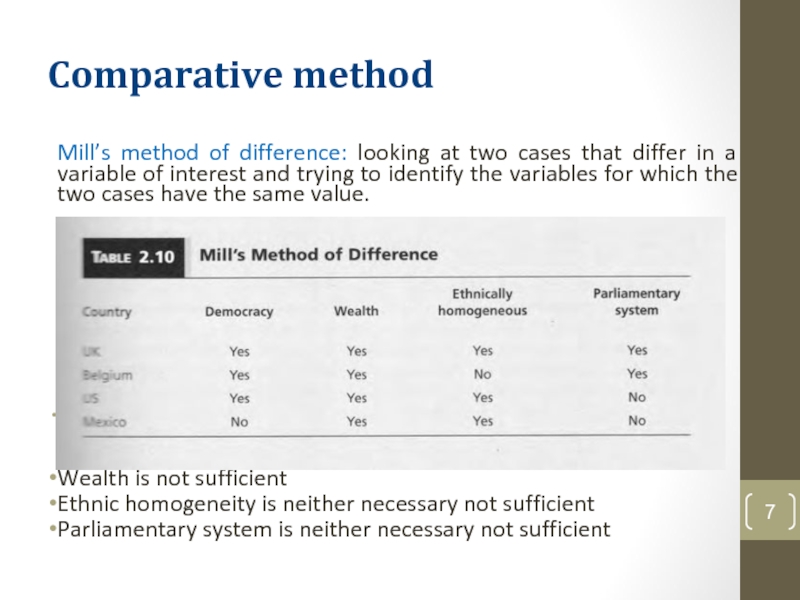
Mill’s method of
agreement: looking at two cases of the same phenomenon, and then trying to identify the variables on which the two cases are different.
Necessary cause: in its absence the phenomenon cannot occur (if not X, never Y).
In the example above, only wealth is a necessary cause.
Слайд 7Comparative method
Mill’s method of difference: looking at two cases that
differ in a variable of interest and trying to identify
the variables for which the two cases have the same value.
(if
(If X, always Y).
Wealth is not sufficient
Ethnic homogeneity is neither necessary not sufficient
Parliamentary system is neither necessary not sufficient
Слайд 8Criticism Against Mill’s Method
Deterministic ( one cause of democracy and
it always produces democracy)
All other causes are identified - can
we be sure?
All causes are independent of each other
Does not answer “why?”
Can we study all countries in all years with all causes?
Hmmm…..we can try
Слайд 9Quantitative methods
Used to understand causal relationship between one variable and
another variable
Popular in the last 30 years
Large number of observations
Regression
analysis – one of the most popular quantitative research methods
Слайд 10Regression analysis
Regression analysis aims to identify how far a dependent
variable changes when any one of a number of independent
variables is varied, while the other independent variables are held fixed.
Hypothesis: more economic development is associated with higher levels of democracy
Слайд 12Regression analysis
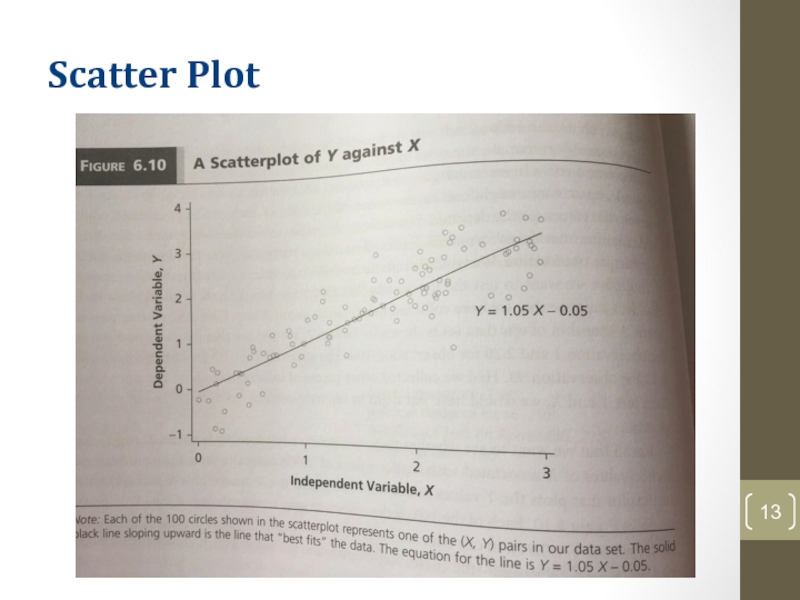
Once the dependent variable (DV) and the independent variable
(IV) are determined, the first step is to make a
scatter diagram (also called a scatter plot).
The vertical line (y-axis) represents the values on the DV and the horizontal line (x-axis) represents the values on the IV. Then, with these values the regression equation is computed.
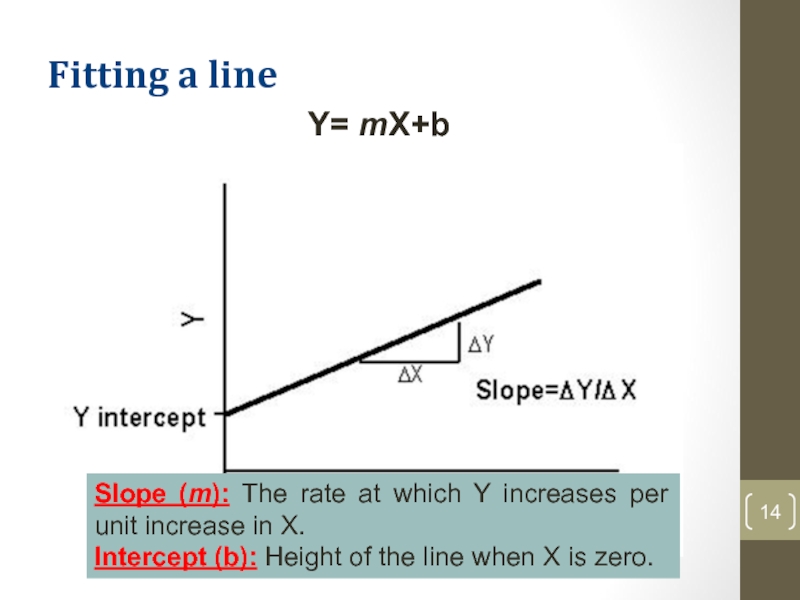
Linear regression finds the best line that predicts Y from X. It can estimate the value of one variable from the value of the other.
Слайд 14Fitting a line
Y= mX+b
Slope (m): The rate at which
Y increases per unit increase in X.
Intercept (b): Height of
the line when X is zero.
Слайд 15Regression Analysis
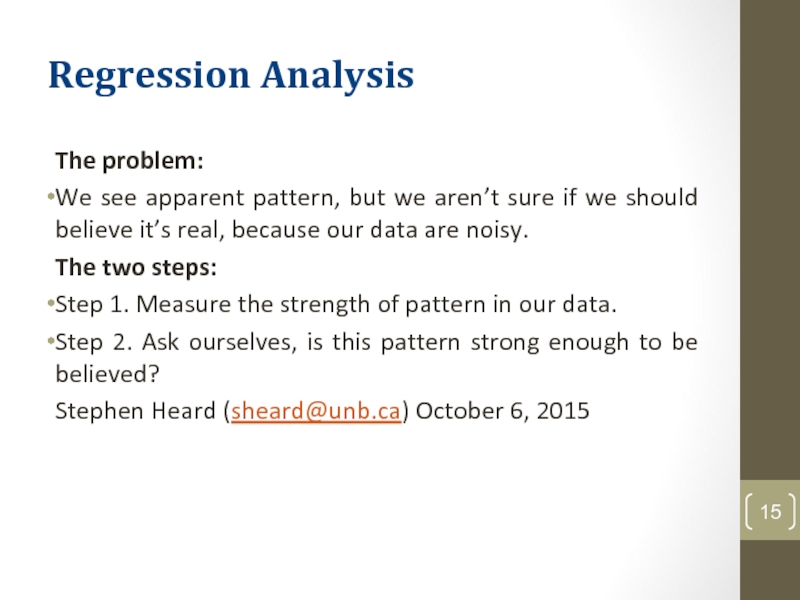
The problem:
We see apparent pattern, but we aren’t sure
if we should believe it’s real, because our data are
noisy.
The two steps:
Step 1. Measure the strength of pattern in our data.
Step 2. Ask ourselves, is this pattern strong enough to be believed?
Stephen Heard (sheard@unb.ca) October 6, 2015
Слайд 16Regression Analysis
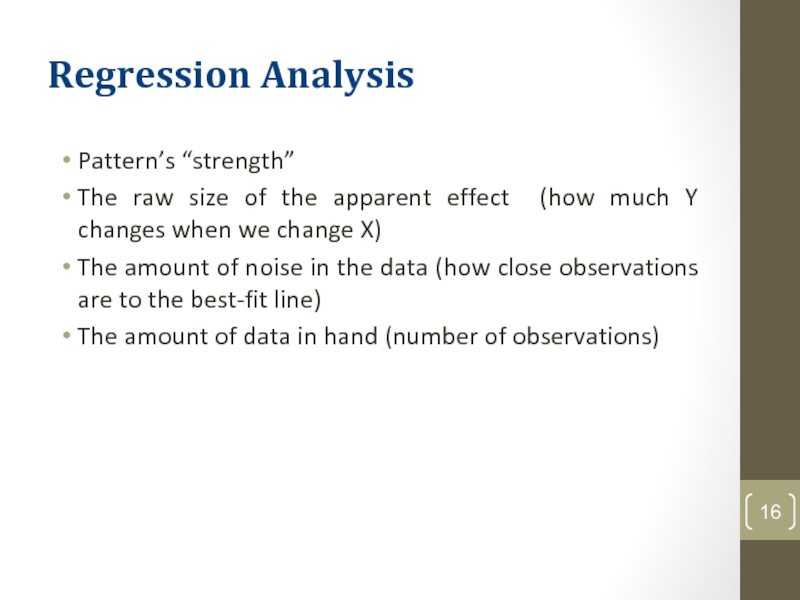
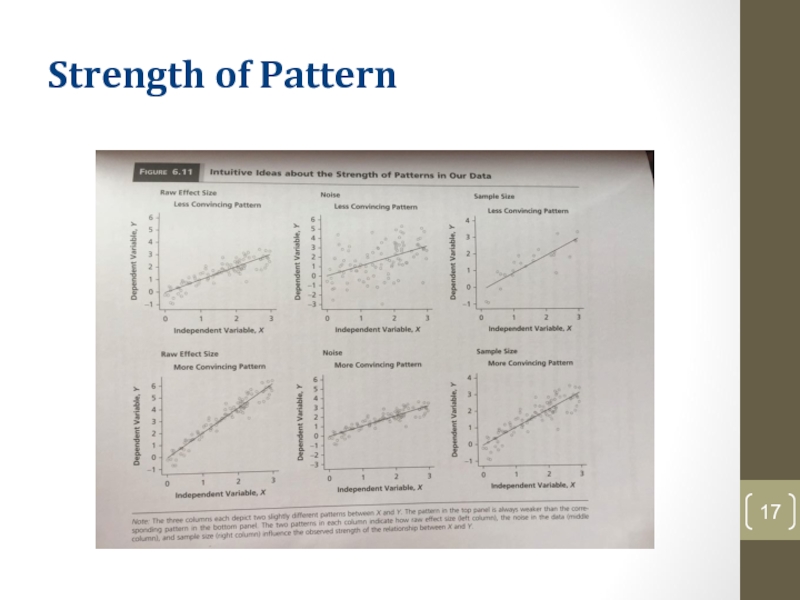
Pattern’s “strength”
The raw size of the apparent effect
(how much Y changes when we change X)
The amount of
noise in the data (how close observations are to the best-fit line)
The amount of data in hand (number of observations)
Слайд 18Significance test
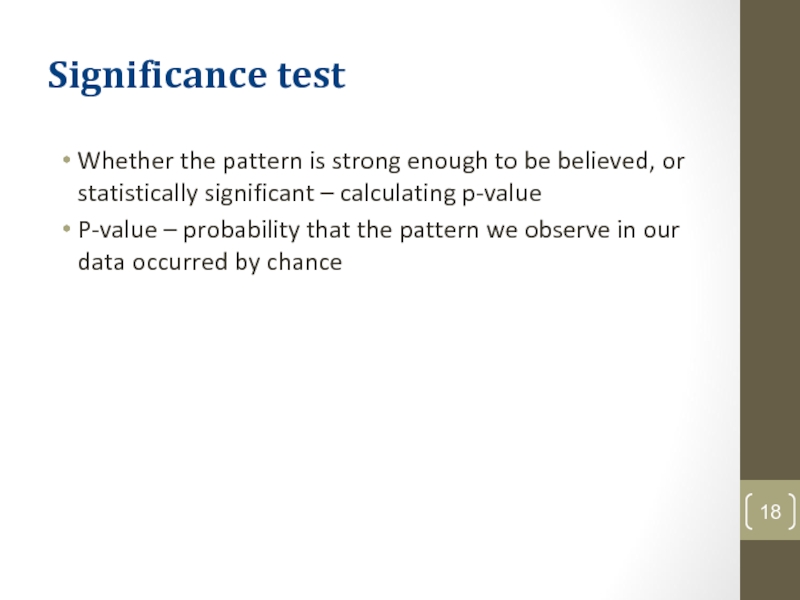
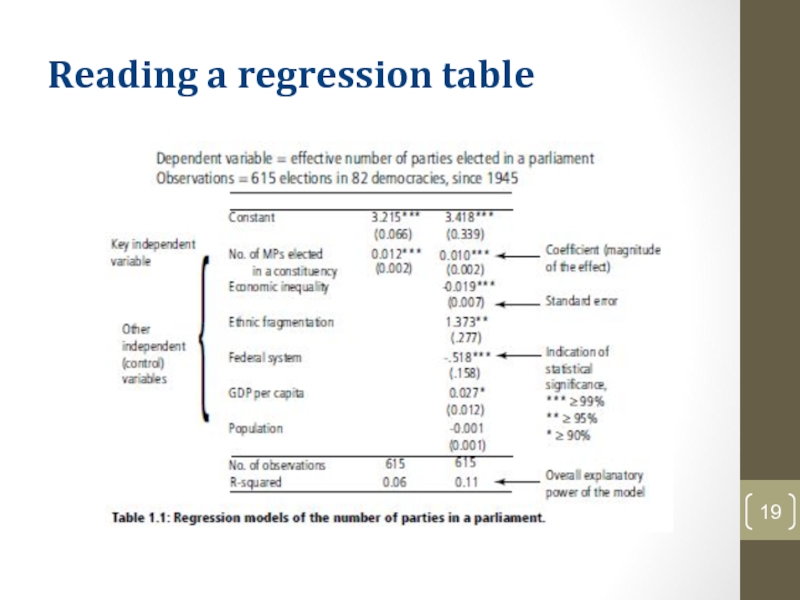
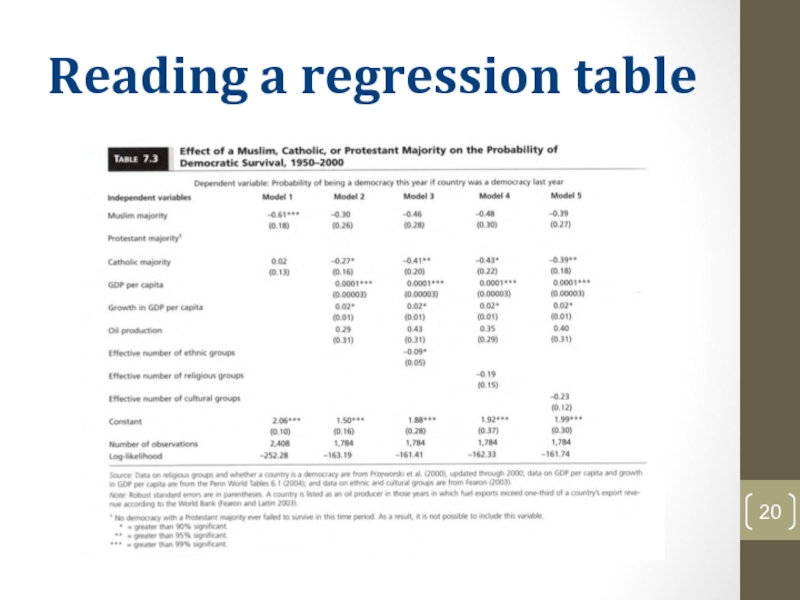
Whether the pattern is strong enough to be believed,
or statistically significant – calculating p-value
P-value – probability that the
pattern we observe in our data occurred by chance

