Разделы презентаций


Презентация 22 презентация, доклад

Plan1. The U.S. dollar2. Oil and Natural gas3. Financial position4. Conclusion

Слайды и текст этой презентации

Слайд 1


Слайд 2Plan
1. The U.S. dollar
2. Oil and Natural gas
3. Financial position
4.

Conclusion

Plan1. The U.S. dollar2. Oil and Natural gas3. Financial position4. Conclusion
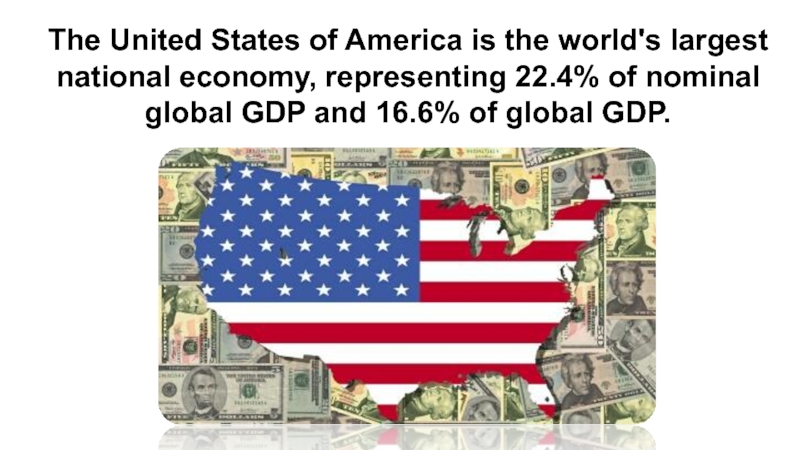
Слайд 3The United States of America is the world's largest national

economy, representing 22.4% of nominal global GDP and 16.6% of

global GDP.
The United States of America is the world's largest national economy, representing 22.4% of nominal global GDP

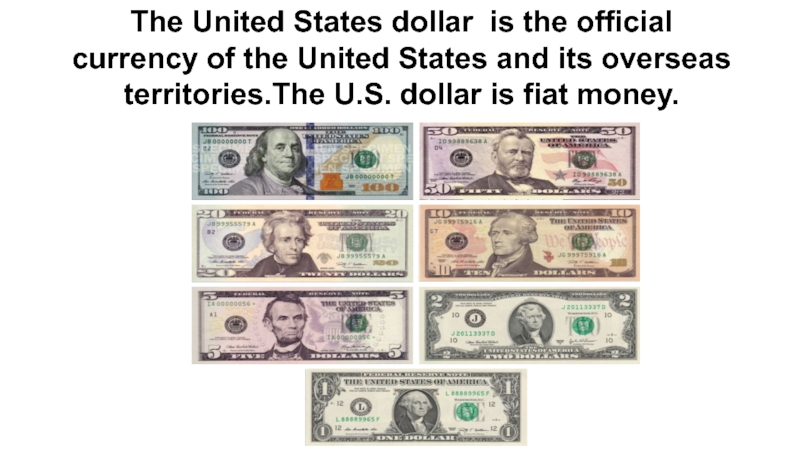
Слайд 4The United States dollar is the official currency of the

United States and its overseas territories.The U.S. dollar is fiat

money.
The United States dollar is the official currency of the United States and its overseas territories.The U.S.

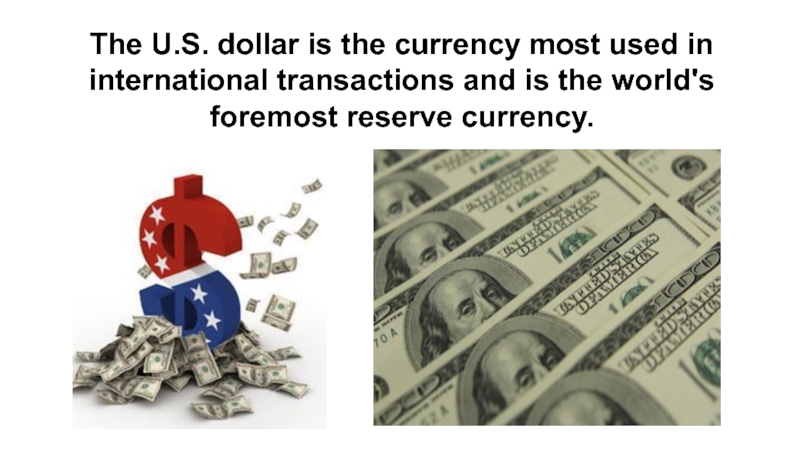
Слайд 5The U.S. dollar is the currency most used in international

transactions and is the world's foremost reserve currency.

The U.S. dollar is the currency most used in international transactions and is the world's foremost reserve

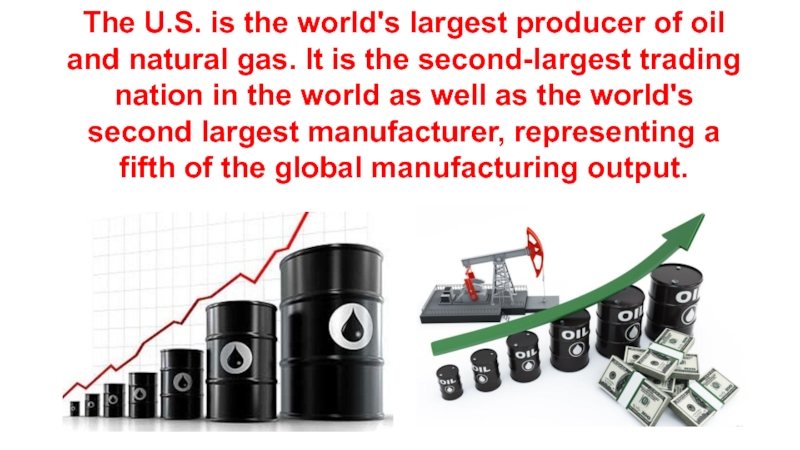
Слайд 6The U.S. is the world's largest producer of oil and

natural gas. It is the second-largest trading nation in the

world as well as the world's second largest manufacturer, representing a fifth of the global manufacturing output.
The U.S. is the world's largest producer of oil and natural gas. It is the second-largest trading

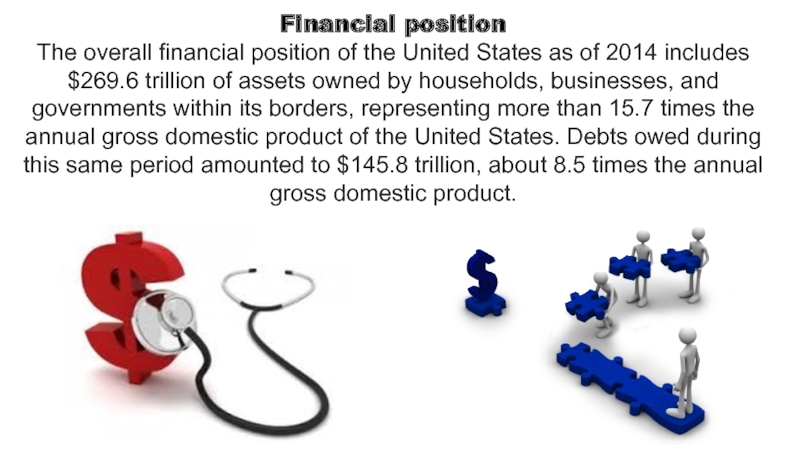
Слайд 7Financial position
The overall financial position of the United States as

of 2014 includes $269.6 trillion of assets owned by households,

businesses, and governments within its borders, representing more than 15.7 times the annual gross domestic product of the United States. Debts owed during this same period amounted to $145.8 trillion, about 8.5 times the annual gross domestic product.
Financial positionThe overall financial position of the United States as of 2014 includes $269.6 trillion of assets

Слайд 8Conclusion
The U.S. economy continues to be a leading competitor and

innovator in the global economy as measured by its overall

performance, market position in S&T industries, and trends in patenting of new technologies at home and abroad. The U.S. economy has grown relatively rapidly and become more productive while sustaining a high and rising per capita income. The U.S. gap with Asia on many of these measures is narrowing, however, because of rapid progress by China and several other countries. Although the EU’s economic position is relatively strong, its market position in S&T industries has either flattened out or slipped.
ConclusionThe U.S. economy continues to be a leading competitor and innovator in the global economy as measured

Обратная связь

Если не удалось найти и скачать доклад-презентацию, Вы можете заказать его на нашем сайте. Мы постараемся найти нужный Вам материал и отправим по электронной почте. Не стесняйтесь обращаться к нам, если у вас возникли вопросы или пожелания:

Email: Нажмите что бы посмотреть 

Что такое TheSlide.ru?

Это сайт презентации, докладов, проектов в PowerPoint. Здесь удобно  хранить и делиться своими презентациями с другими пользователями.


Для правообладателей

Яндекс.Метрика