Разделы презентаций
- Разное
- Английский язык
- Астрономия
- Алгебра
- Биология
- География
- Геометрия
- Детские презентации
- Информатика
- История
- Литература
- Математика
- Медицина
- Менеджмент
- Музыка
- МХК
- Немецкий язык
- ОБЖ
- Обществознание
- Окружающий мир
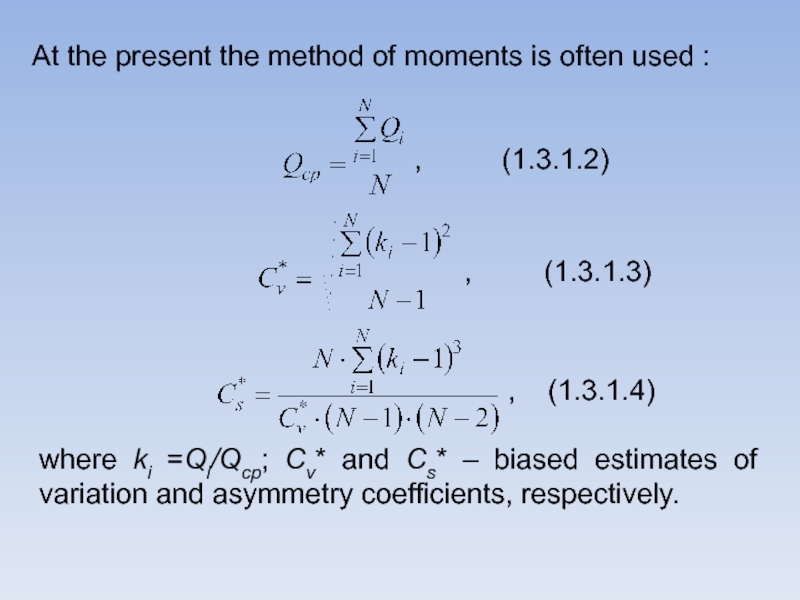
- Педагогика
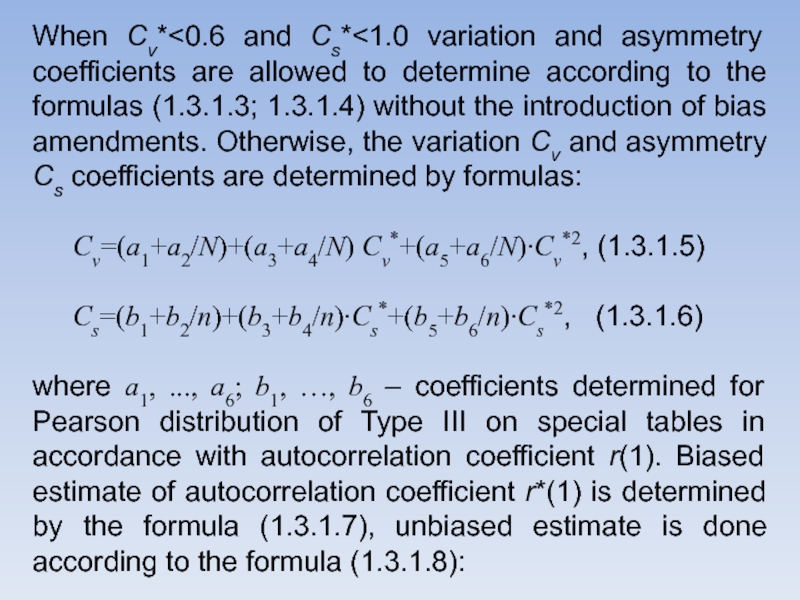
- Русский язык
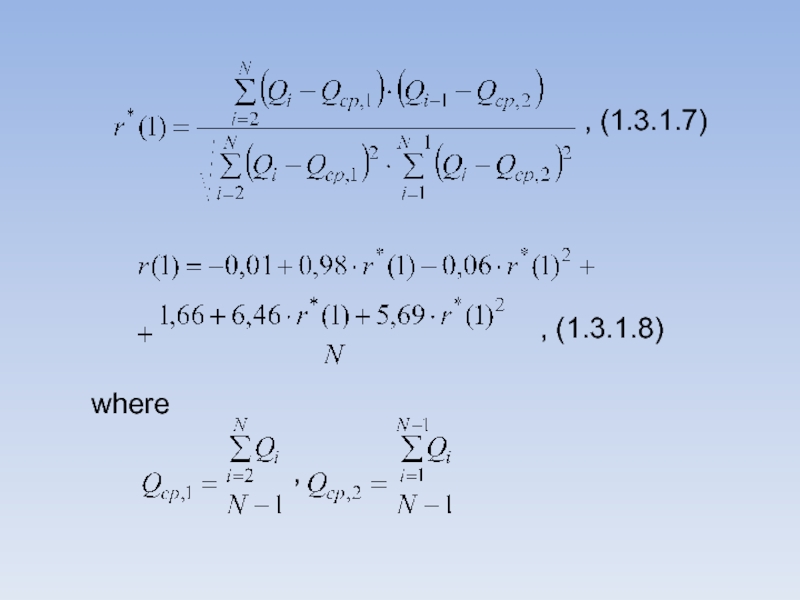
- Технология
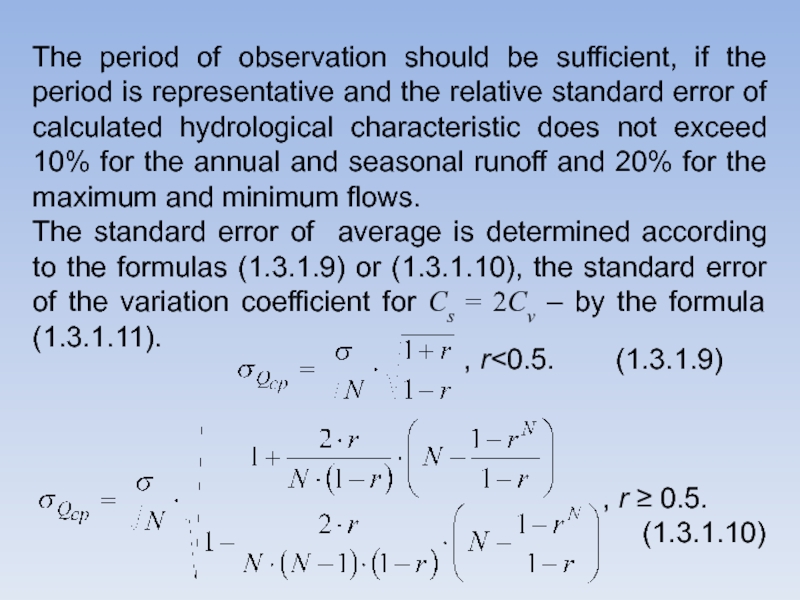
- Физика
- Философия
- Химия
- Шаблоны, картинки для презентаций
- Экология
- Экономика
- Юриспруденция
Hydrological calculations in Siberia (the Russian Federation): the basic
Содержание
- 1. Hydrological calculations in Siberia (the Russian Federation): the basic
- 2. Brief informa-tion about methods of hydrolo-gical calcula-tions
- 3. Hydrological Calculations (or Engineering Hydrology) are an
- 4. Usually it is enough to obtain information
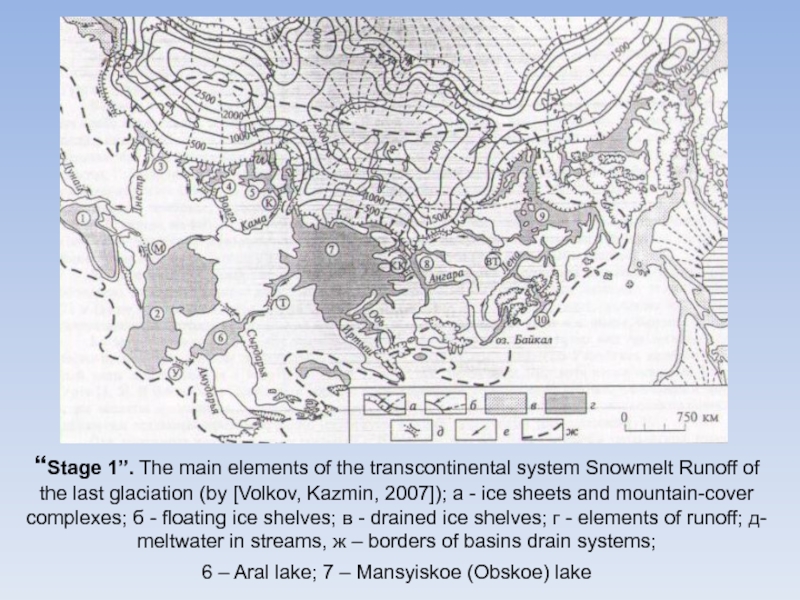
- 5. “Stage 1”. The main elements of the
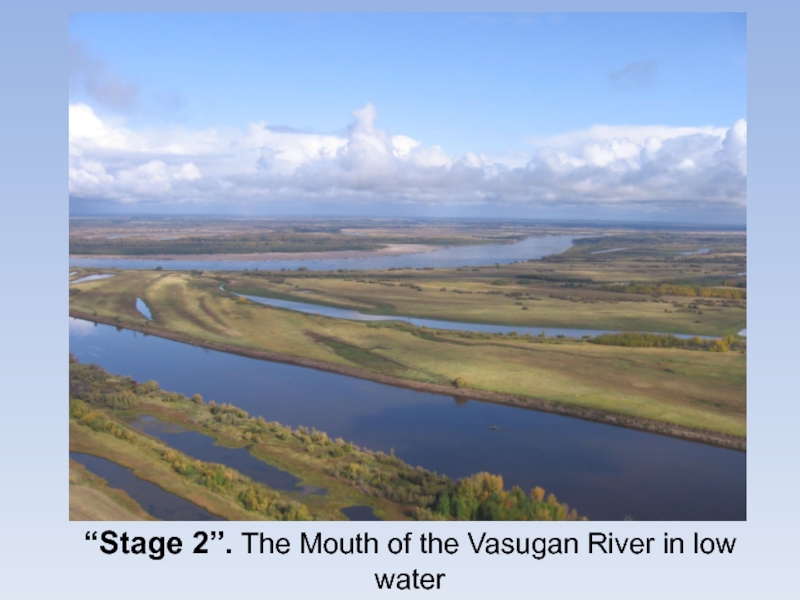
- 6. “Stage 2”. The Mouth of the Vasugan River in low water
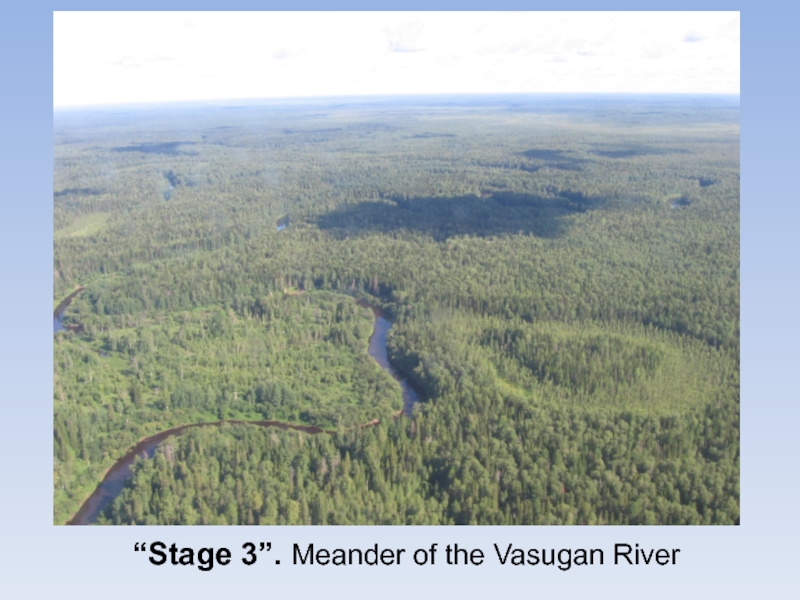
- 7. “Stage 3”. Meander of the Vasugan River
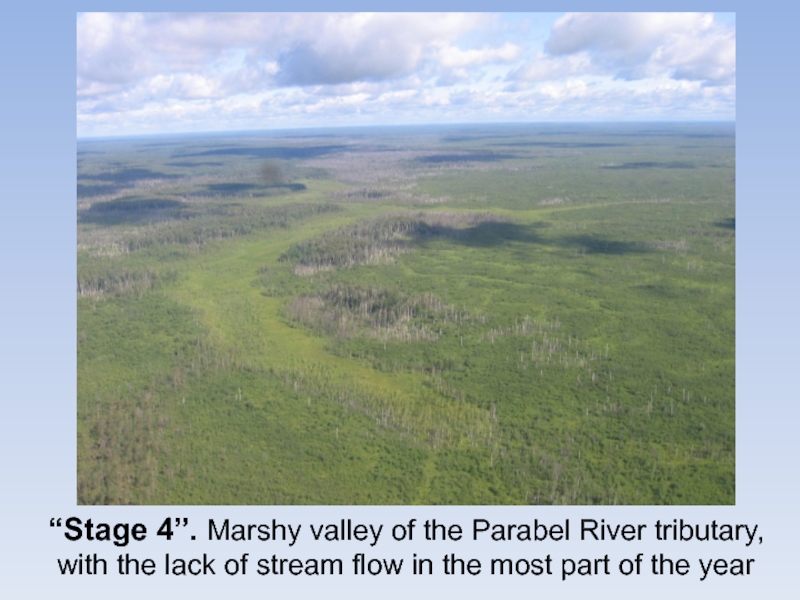
- 8. “Stage 4”. Marshy valley of the Parabel
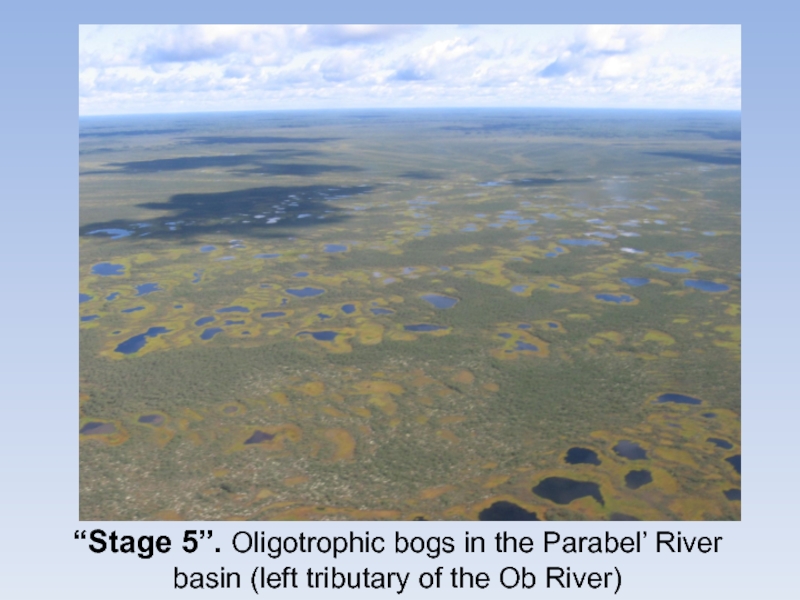
- 9. “Stage 5”. Oligotrophic bogs in the Parabel’ River basin (left tributary of the Ob River)
- 10. If we want to understand what will
- 11. Now it is made much enough for
- 12. Hydrology key concept is Flow – the
- 13. Each water body is formed by the
- 14. 1.1. Expert analysis of initial hydrological informationThe
- 15. In Russia Geographical-Hydrological Method is often used
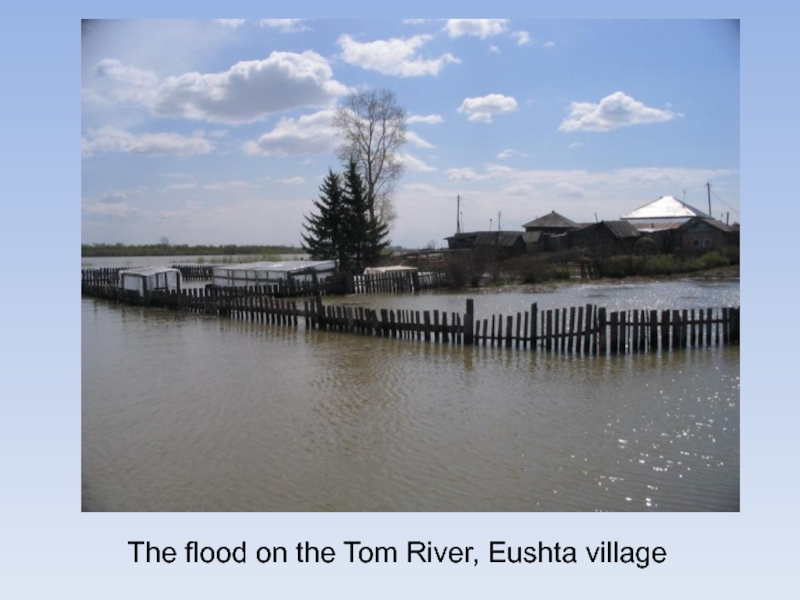
- 16. The river-analogue is a river with similar
- 17. 1.2. Statistical analysis of initial hydrological informationProper
- 18. 1.3. Choice of a design schemeHydrological Calculations
- 19. Selection of distribution function type is made
- 20. In Russia, as a rule, three-parameter distribution
- 21. At the present the method of moments
- 22. When Cv*
- 23. , (1.3.1.7), (1.3.1.8)where,
- 24. The period of observation should be sufficient,
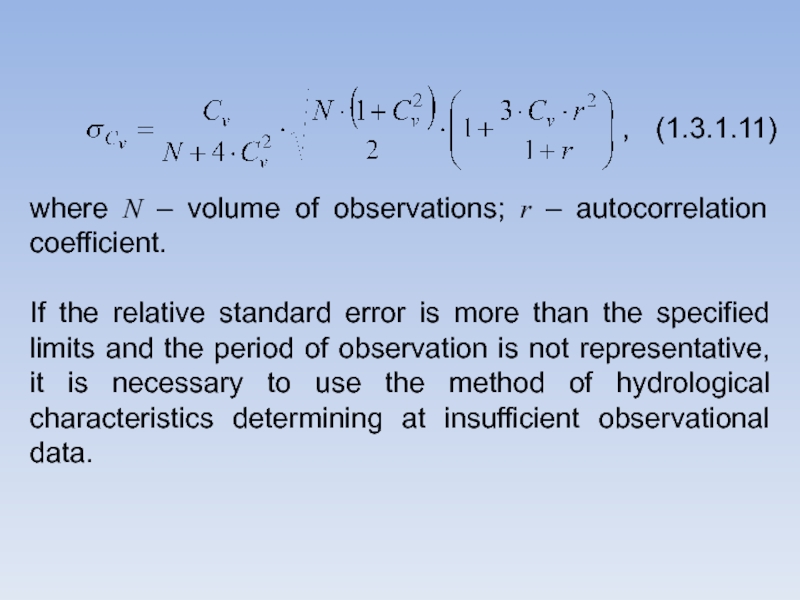
- 25. , (1.3.1.11)where N – volume of
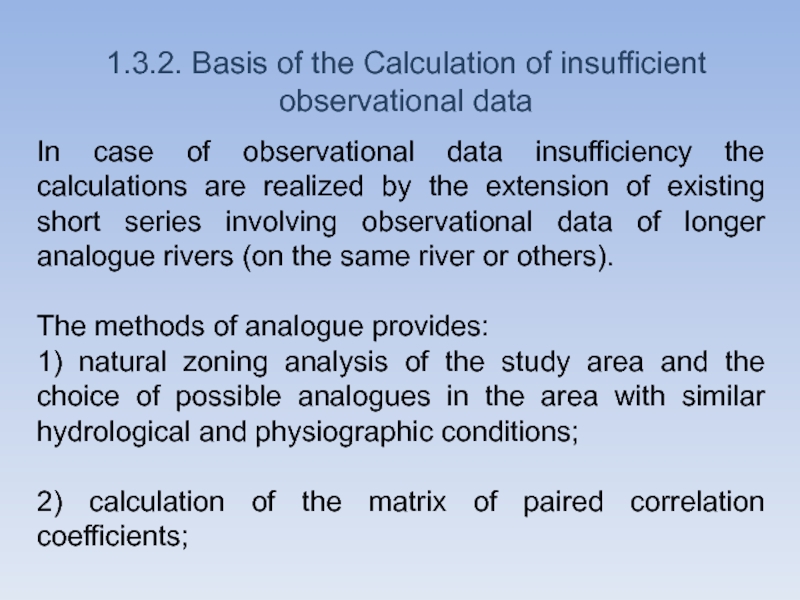
- 26. 1.3.2. Basis of the Calculation of insufficient
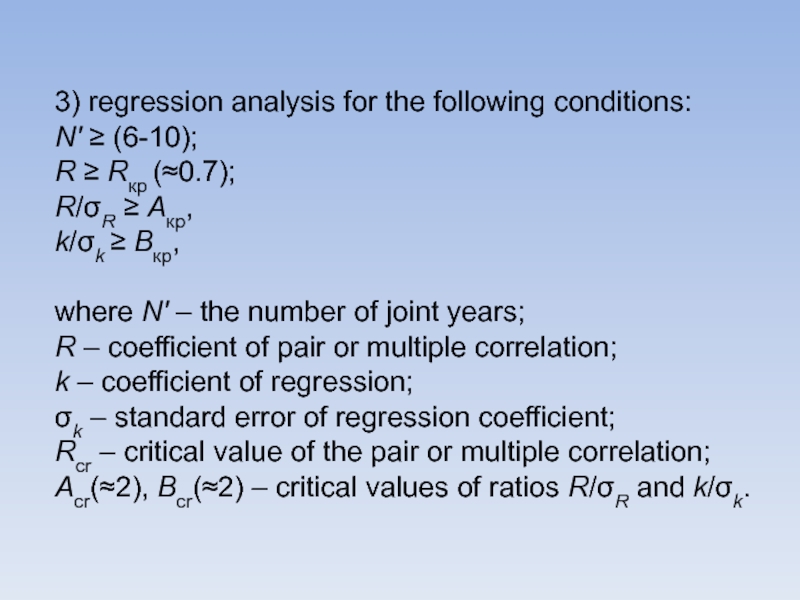
- 27. 3) regression analysis for the following conditions:
- 28. 1.3.3. Basis of the Calculation in the
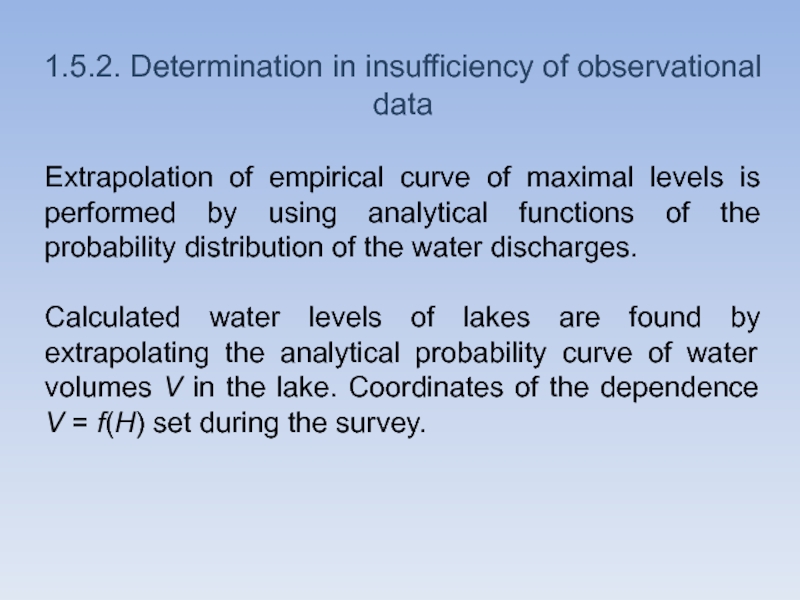
- 29. 1.4. Calculations of Water Flow1.4.1. Annual runoff1.4.1.1.
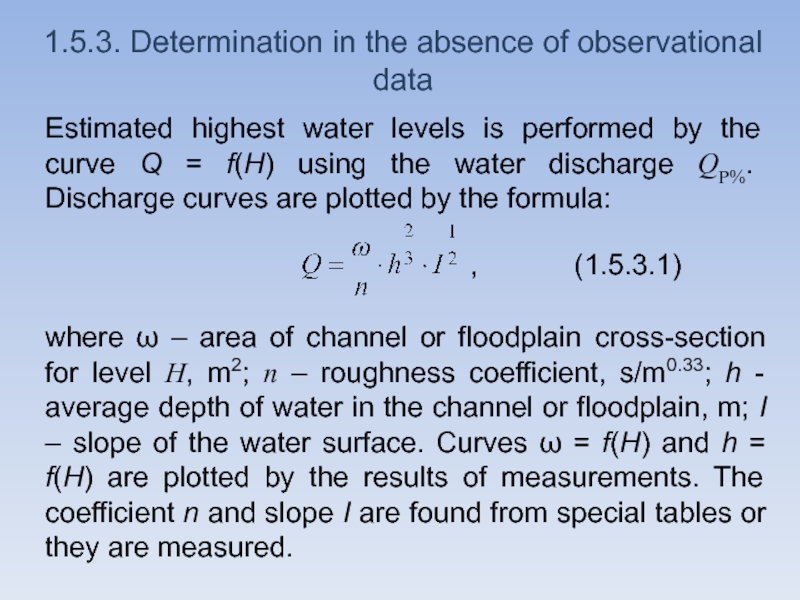
- 30. 1.4.1.2. Determination of insufficiency of observational dataIn
- 31. The relative standard error is determined by
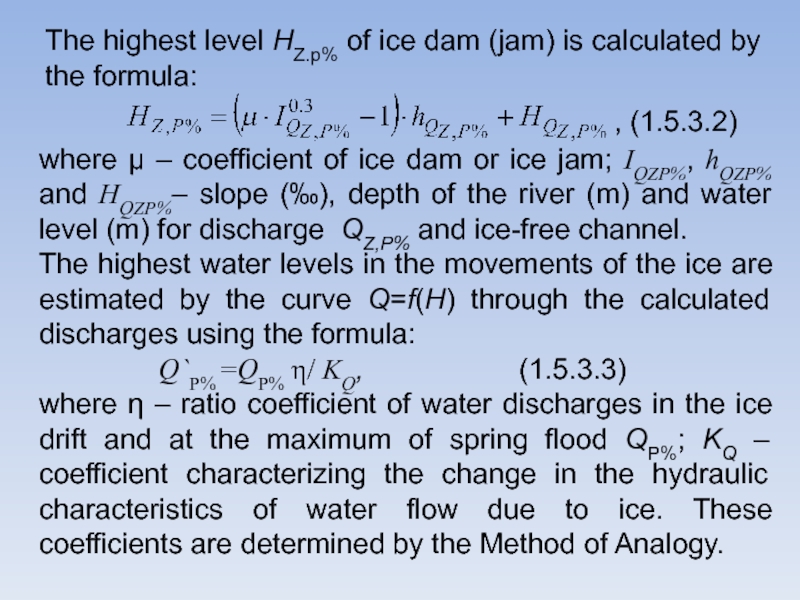
- 32. In the second case, the annual values
- 33. The parameters are determined by: 1) river
- 34. 1.4.2. Maximum flow1.4.2.1. Determination in the presence
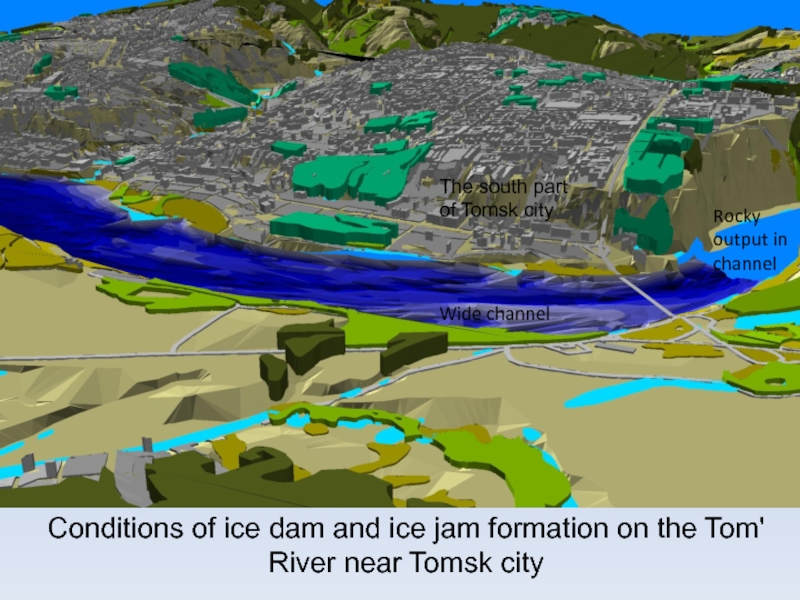
- 35. Characteristics of peak flow, as in the
- 36. Calculation formulas of maximum charges are generally
- 37. 1.4.2.3.1. Snow Melt FloodThe basic design equation
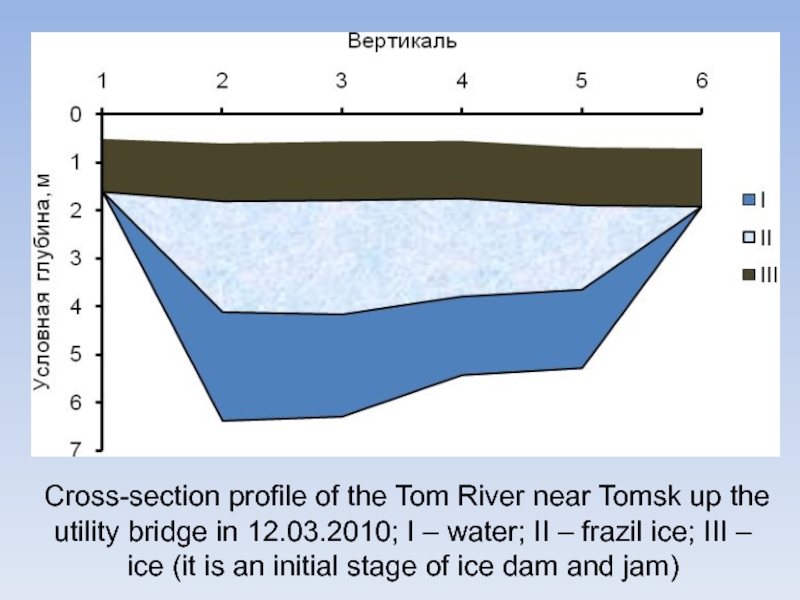
- 38. Coefficient is determined by the formula:
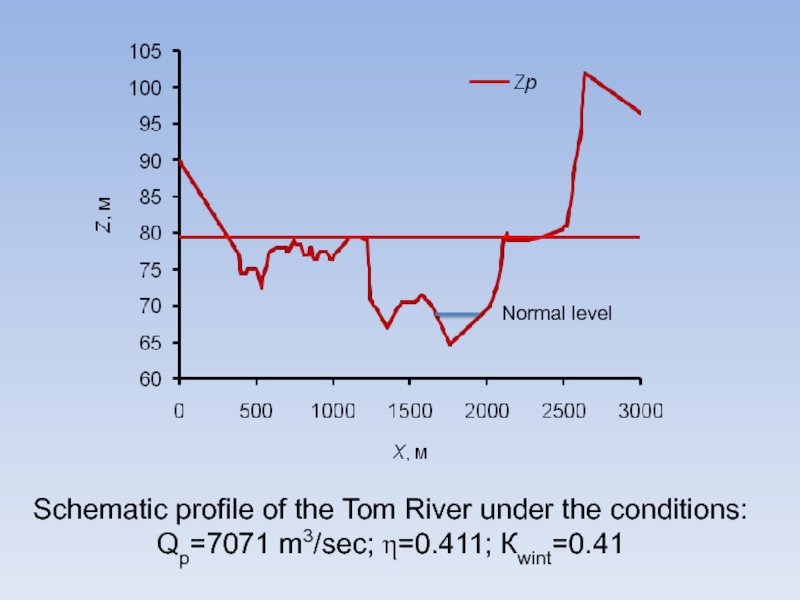
- 39. The Dependence of maximum specific discharge (Мmax)
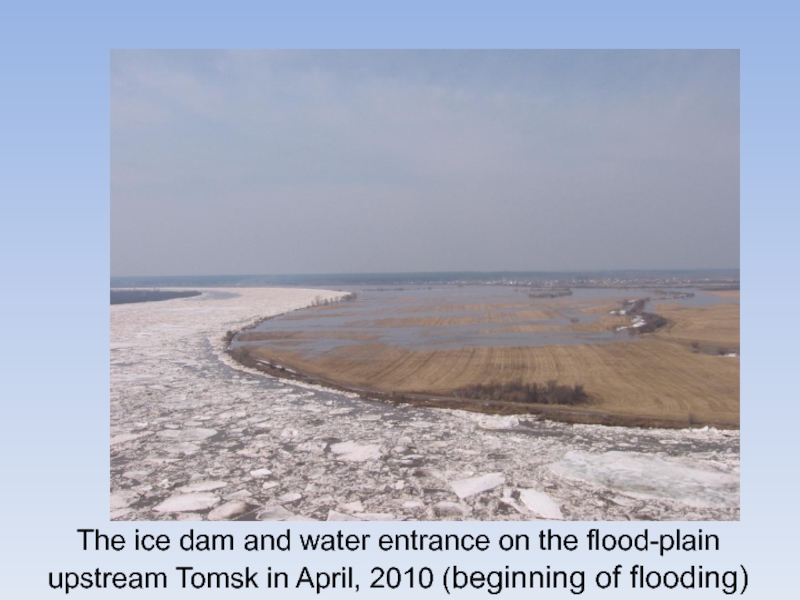
- 40. In the presence of the meteorological data
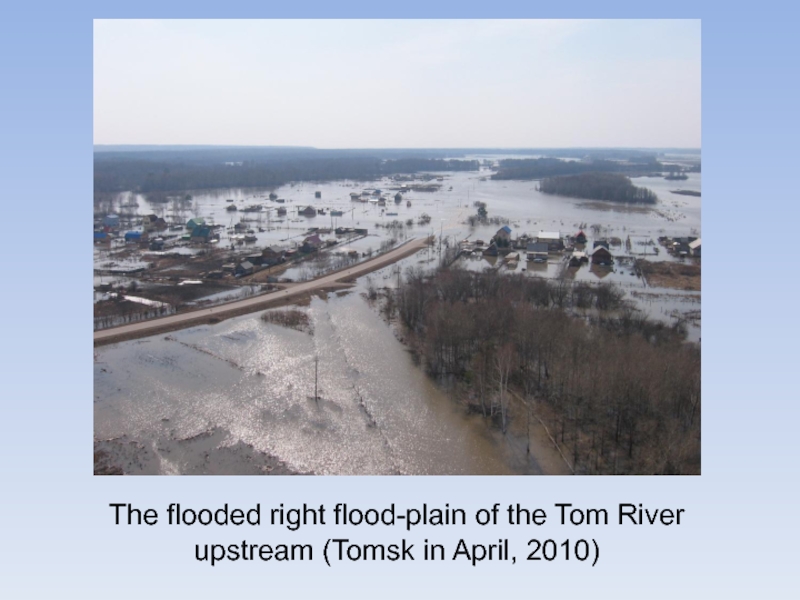
- 41. The flooded right flood-plain of the Tom Riverupstream (Tomsk in April, 2010)
- 42. 1.4.2.3.2. Rainfall FloodCalculation formula type for determination
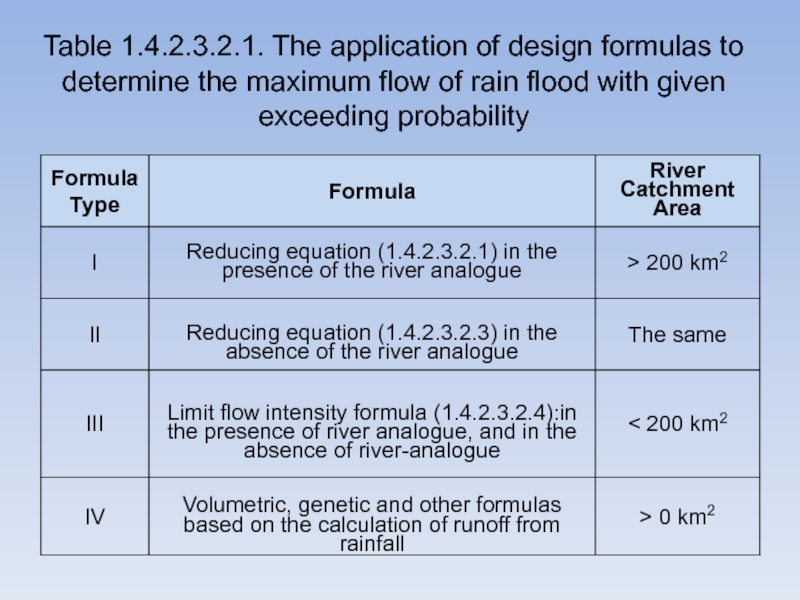
- 43. Table 1.4.2.3.2.1. The application of design formulas
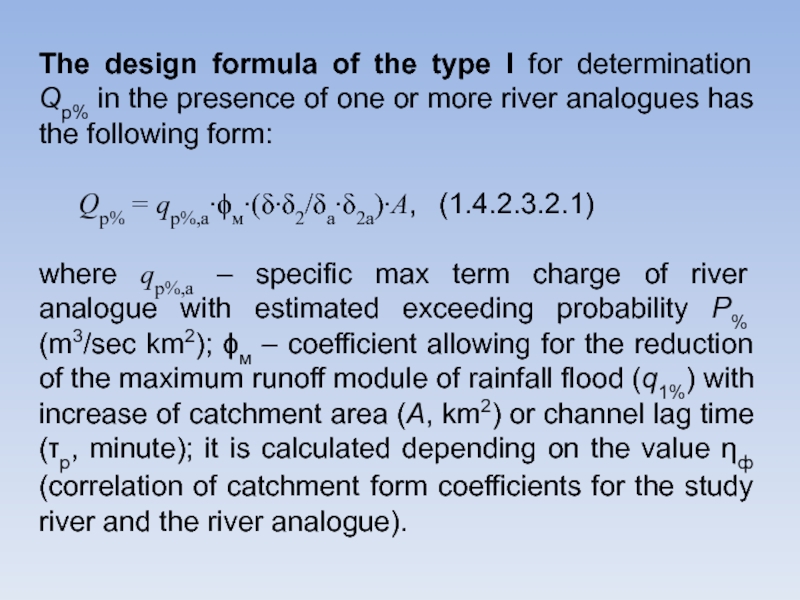
- 44. The design formula of the type I
- 45. Channel Lag Time р (h) for the
- 46. The design formula of the type III
- 47. , (1.4.2.3.2.6)In the absence of rivers analogues collecting
- 48. The flood on the Tom River, Eushta village
- 49. 1.4.3. Minimum runoff1.4.3.1. Determination in the presence
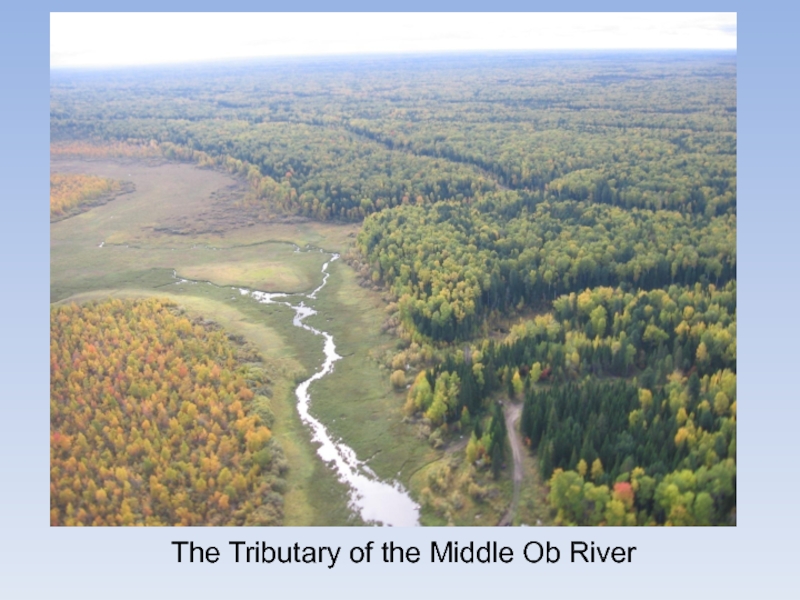
- 50. The Tributary of the Middle Ob River
- 51. 1.4.3.2. Determination in insufficiency of observational dataThe
- 52. QР% = b∙(A ± A1)m∙1∙2∙Р%, (1.4.3.3.1)where А
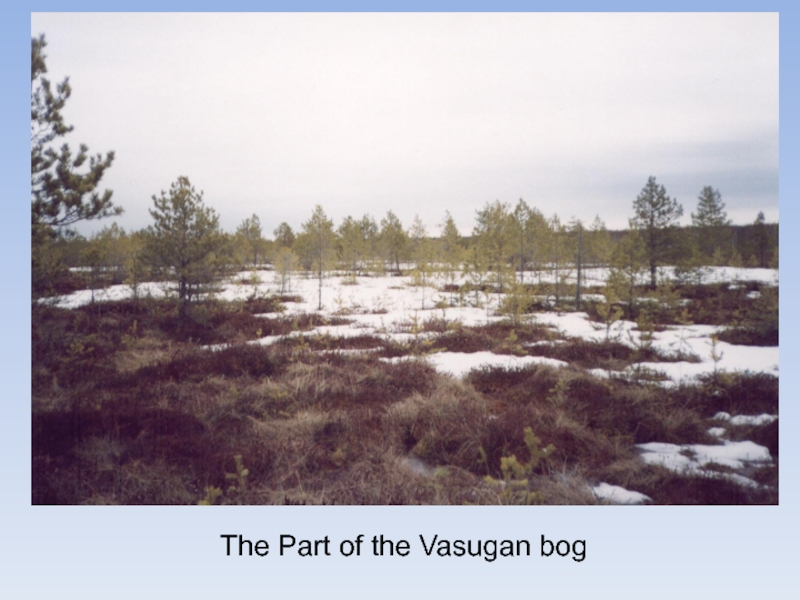
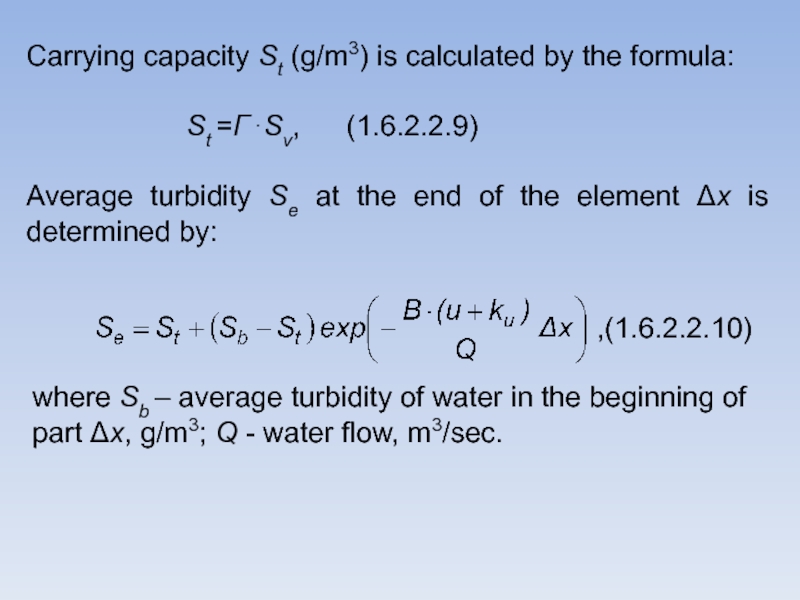
- 53. The Part of the Vasugan bog
- 54. 1.4.4. Annual distribution of stream flow1.4.4.1. Determination
- 55. When the observation period n is from
- 56. The simplest method is the Method of
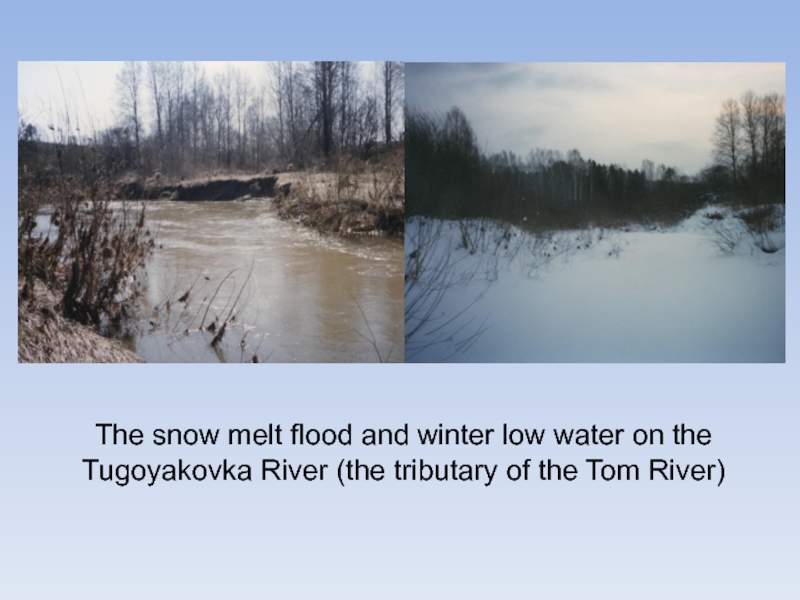
- 57. The snow melt flood and winter low
- 58. 1.4.4.2. Determination in insufficiency of observational dataThe
- 59. 1.5. Calculations of the characteristic water levels1.5.1.
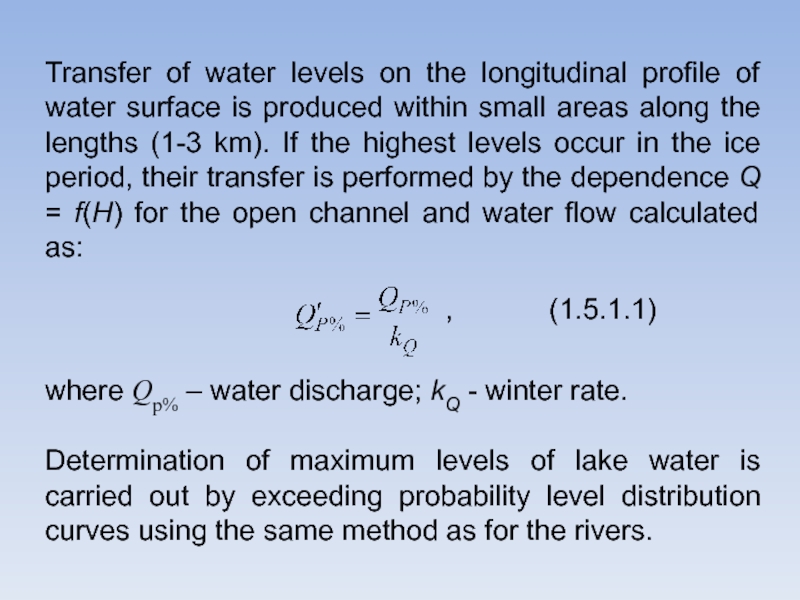
- 60. Transfer of water levels on the longitudinal
- 61. 1.5.2. Determination in insufficiency of observational dataExtrapolation
- 62. 1.5.3. Determination in the absence of observational
- 63. For determination of the highest water levels
- 64. The highest level HZ.р% of ice dam
- 65. The road flooding is the result of
- 66. To calculate the maximum water levels of
- 67. The Tom' River (tributary of the Ob
- 68. Here is a rock where flow velocities
- 69. Conditions of ice dam and ice jam
- 70. Cross-section profile of the Tom River near
- 71. Schematic profile of the Tom River under the conditions: Qp=7071 m3/sec; =0.411; Кwint=0.41Normal level
- 72. The ice dam and water entrance on the flood-plainupstream Tomsk in April, 2010 (beginning of flooding)
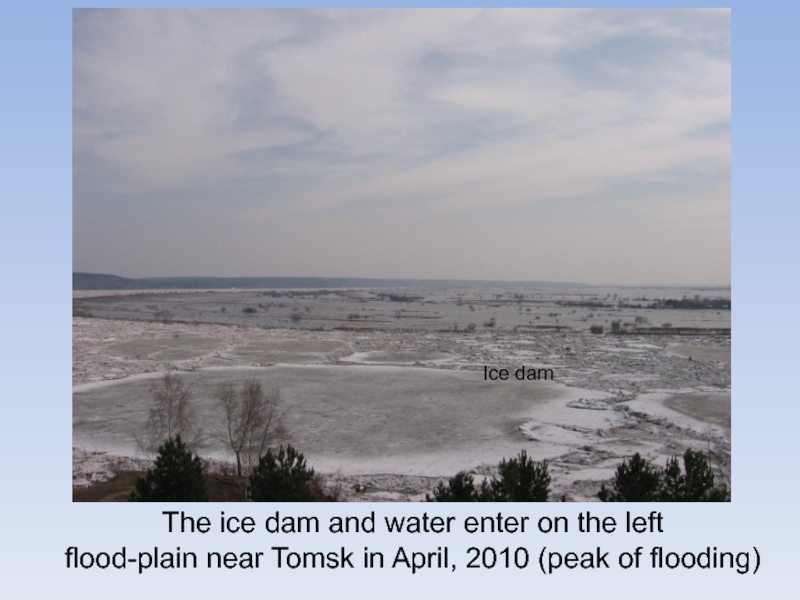
- 73. The ice dam and water enter on
- 74. 1.6. Calculations of the sediment runoff and
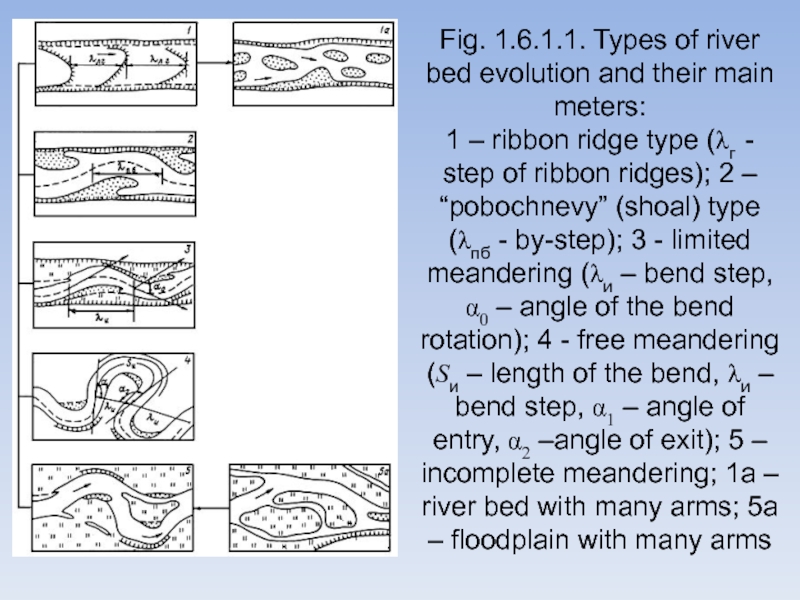
- 75. Fig. 1.6.1.1. Types of river bed evolution
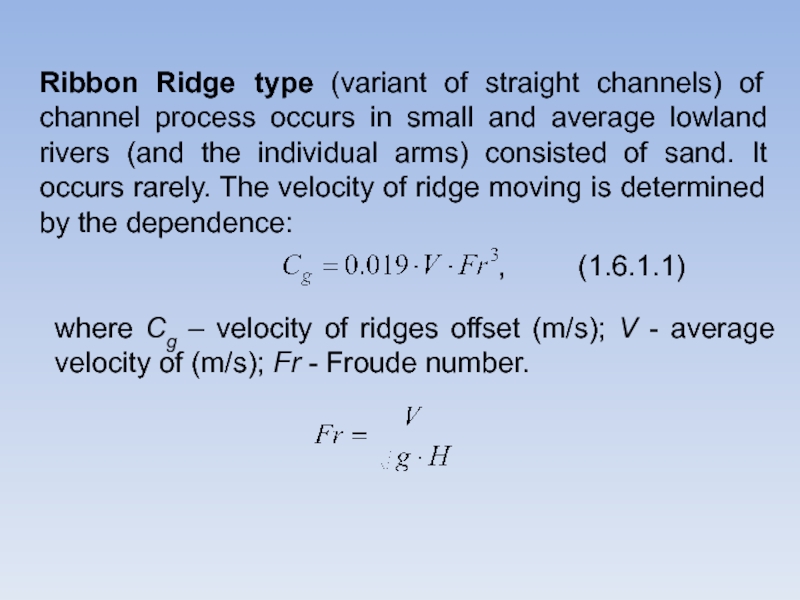
- 76. Ribbon Ridge type (variant of straight channels)
- 77. “Pobochnevy” (shoal; a variant of straight channels)
- 78. Free meandering (variant of meandering channels) is
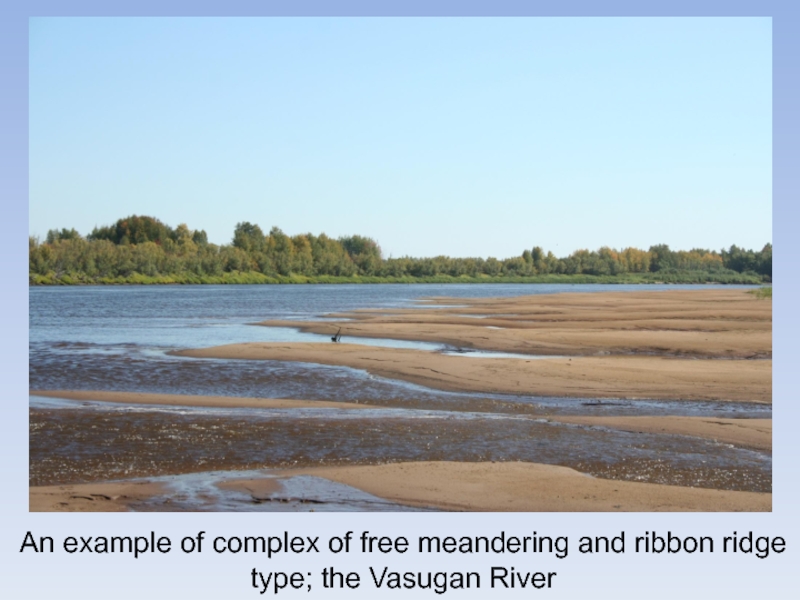
- 79. An example of complex of free meandering and ribbon ridge type; the Vasugan River
- 80. Floodplain with many arms (variant of braided
- 81. 1.6.2. Suspended Sediment Runoff1.6.2.1. Determination in presence
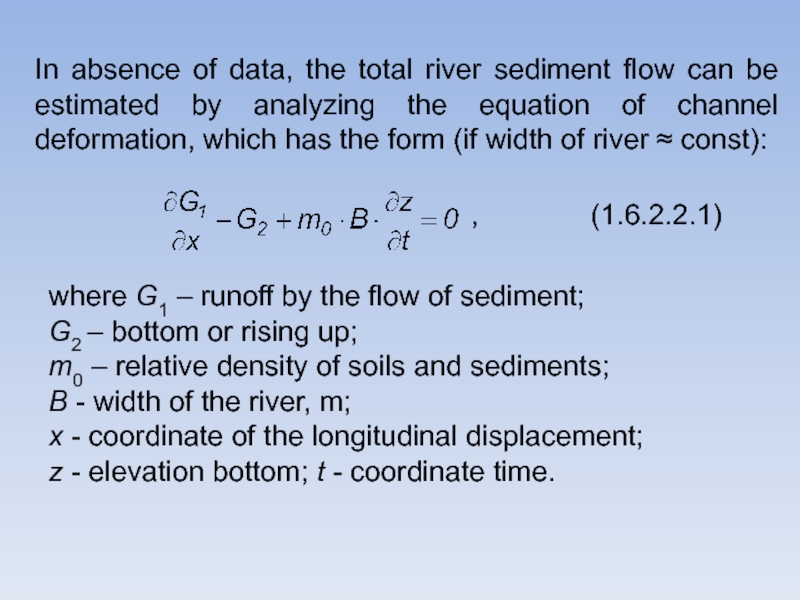
- 82. In absence of data, the total river
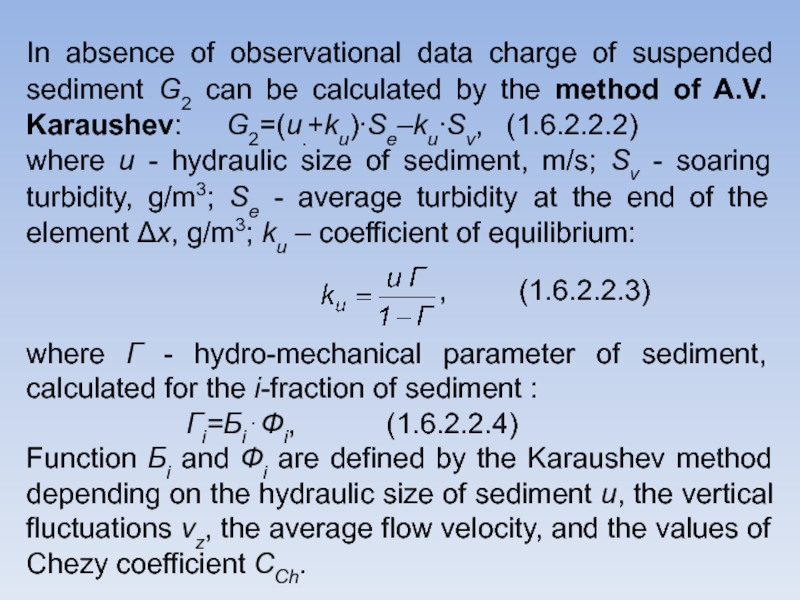
- 83. In absence of observational data charge of
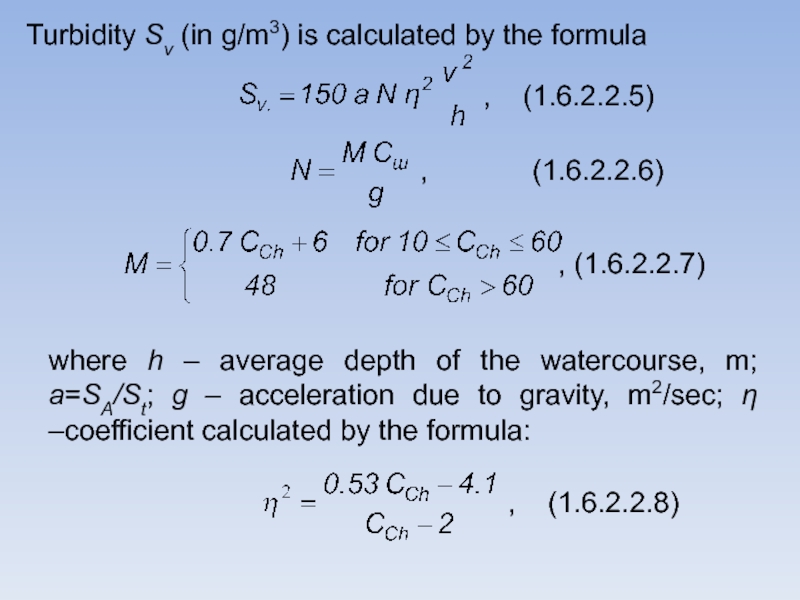
- 84. Turbidity Sv (in g/m3) is calculated by
- 85. Carrying capacity St (g/m3) is calculated by
- 86. 1.6.3. Bed Load Runoff1.6.3.1. Determination in the
- 87. Method of I.I. Levy. The calculation of
- 88. Method of G.I. Shamov. The calculation of
- 89. Method of V.N. Goncharov. V.N. Goncharov has
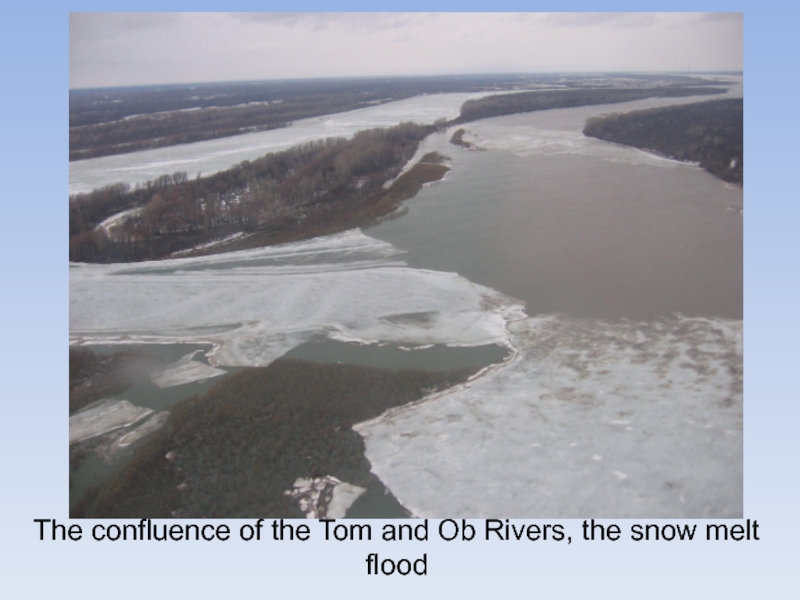
- 90. The confluence of the Tom and Ob Rivers, the snow melt flood
- 91. 1.6.4. Vertical Deformation of Riverbed 1.6.4.1. Determination
- 92. 1.6.4.2. Determination in insufficiency or absence of
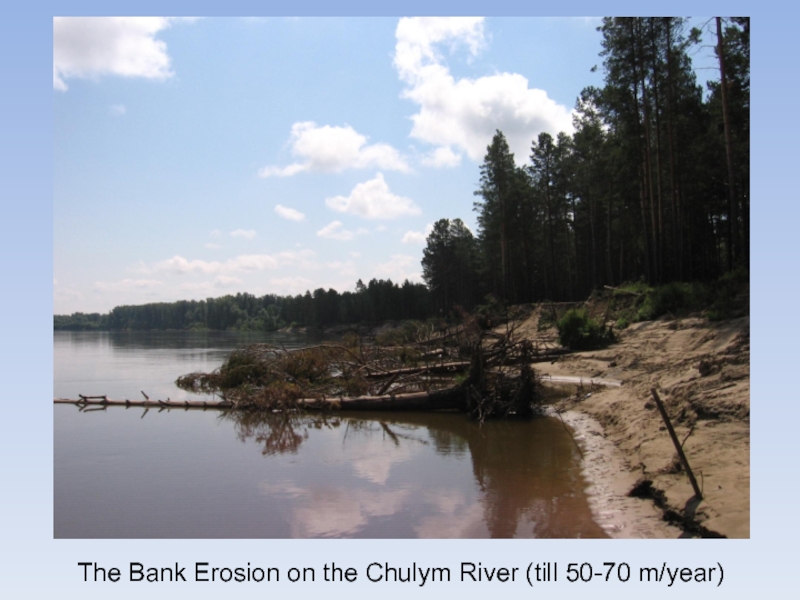
- 93. The Bank Erosion on the Chulym River (till 50-70 m/year)
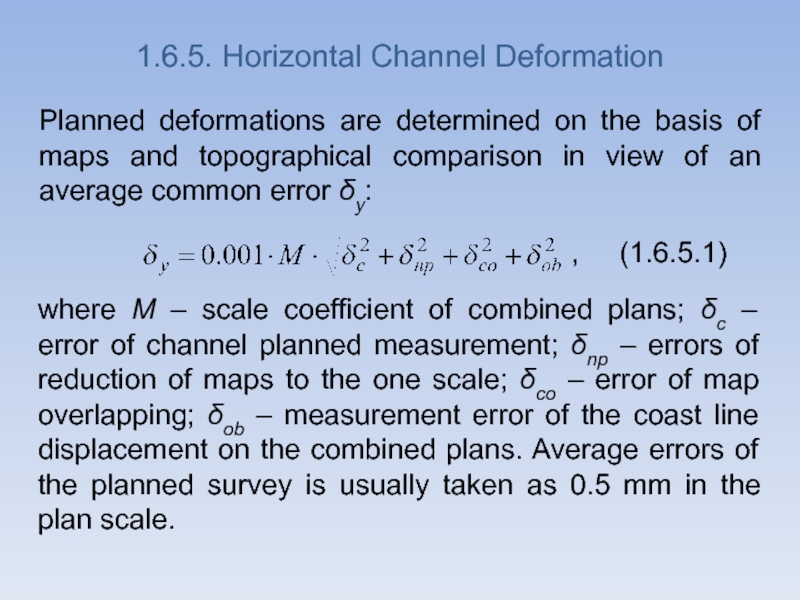
- 94. 1.6.5. Horizontal Channel Deformation Planned deformations are
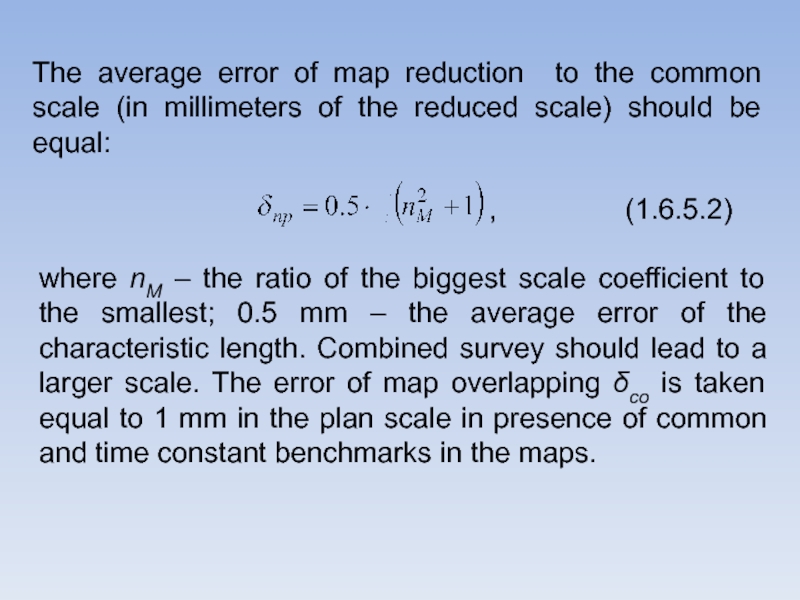
- 95. The average error of map reduction to
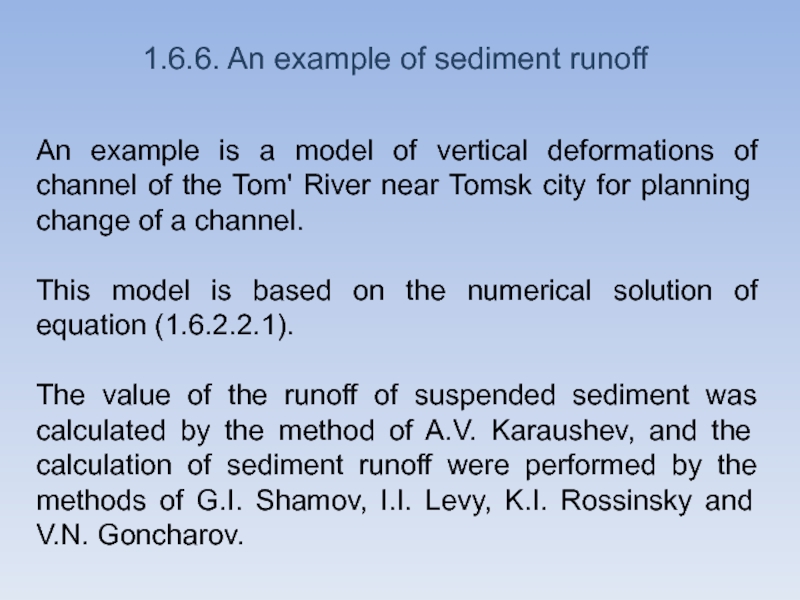
- 96. 1.6.6. An example of sediment runoffAn example
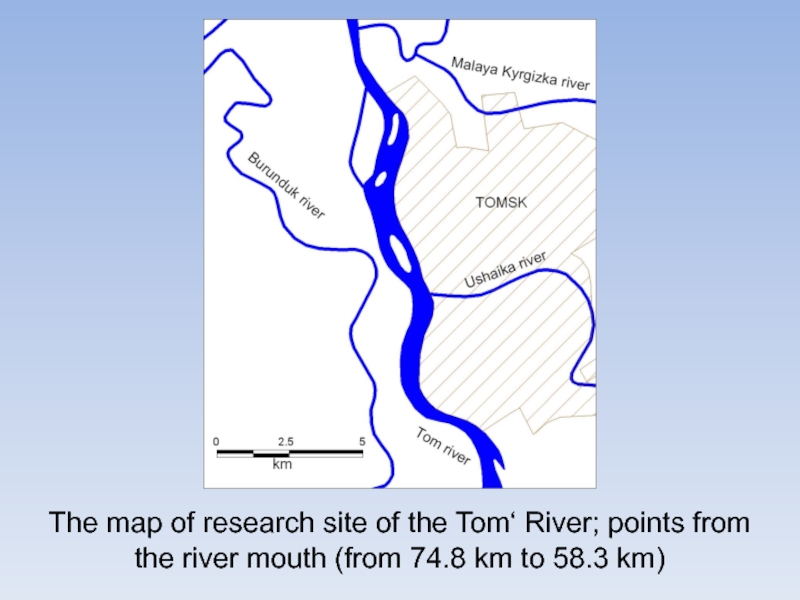
- 97. The map of research site of the
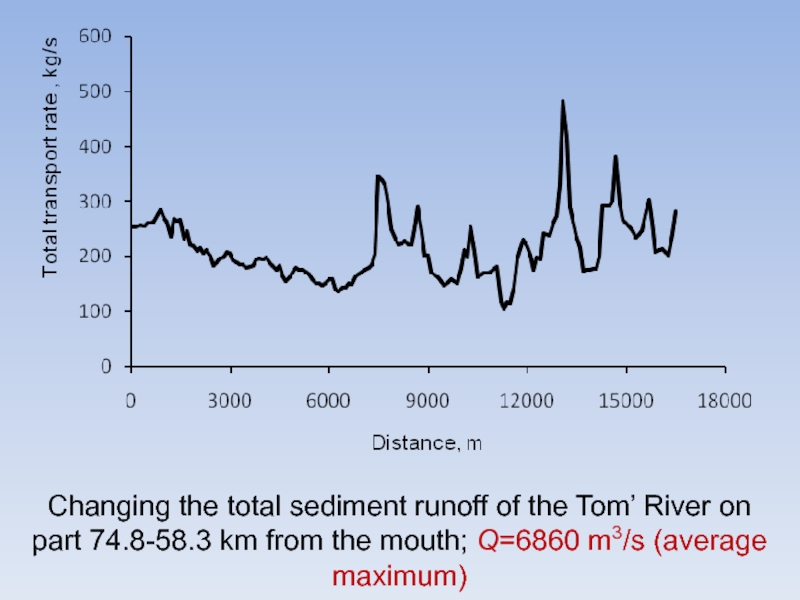
- 98. Changing the total sediment runoff of the
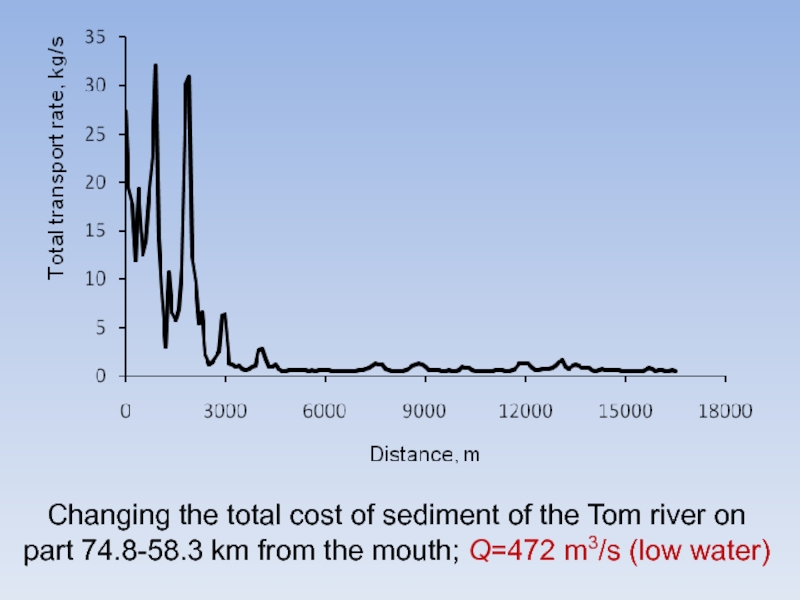
- 99. Changing the total cost of sediment of
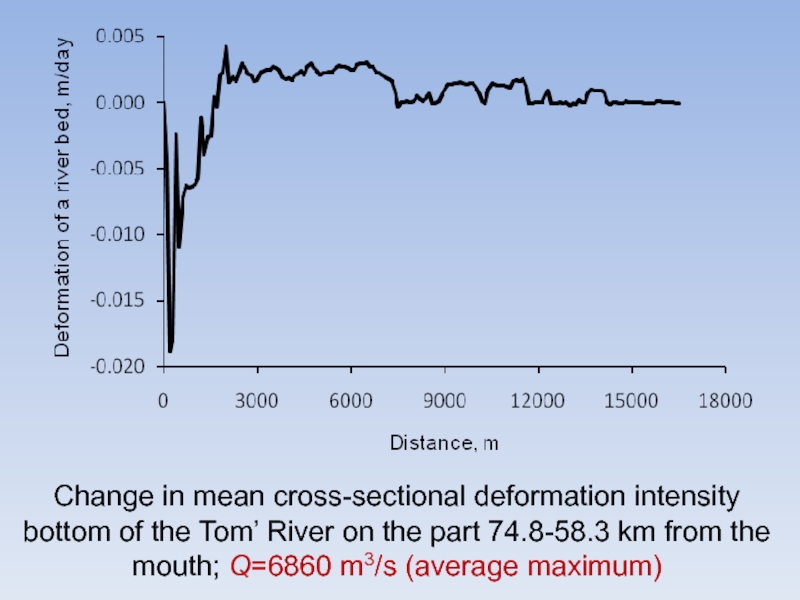
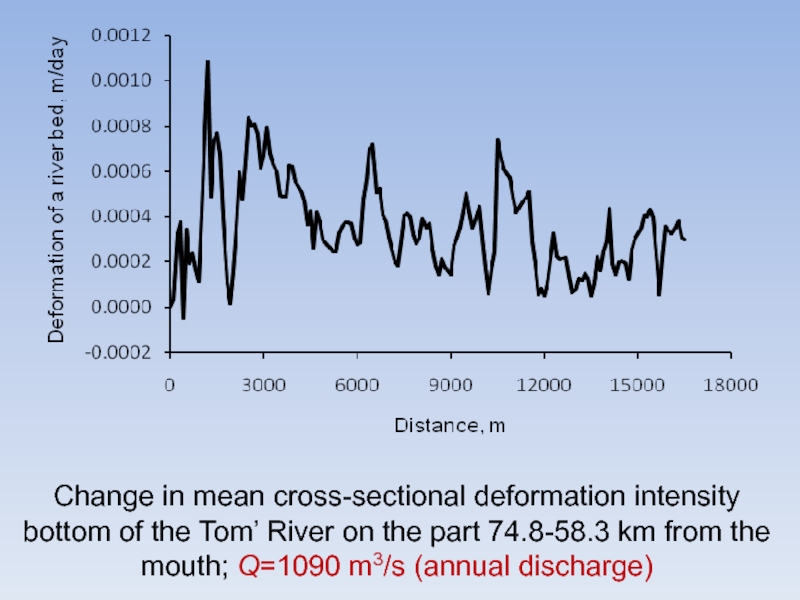
- 100. Change in mean cross-sectional deformation intensity bottom
- 101. Change in mean cross-sectional deformation intensity bottom
- 102. 2. Features of mathematical modeling of hydrological
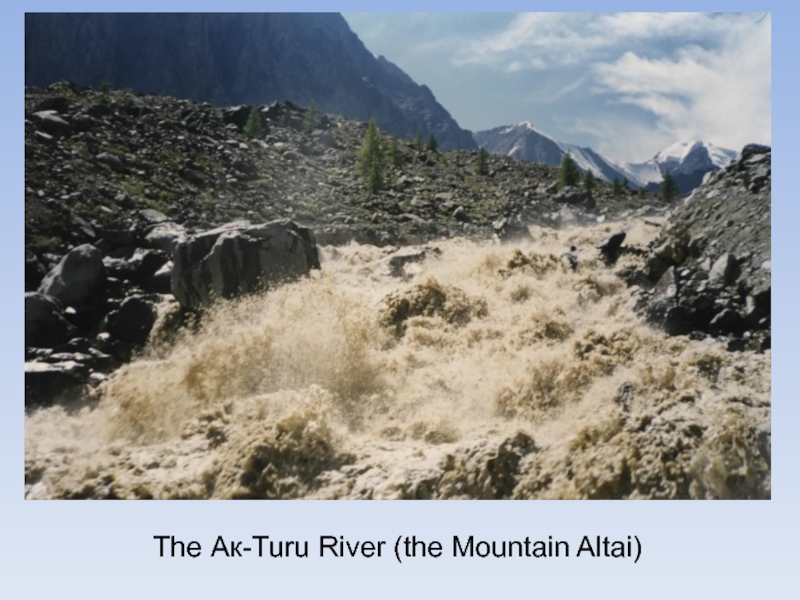
- 103. The Ак-Turu River (the Mountain Altai)
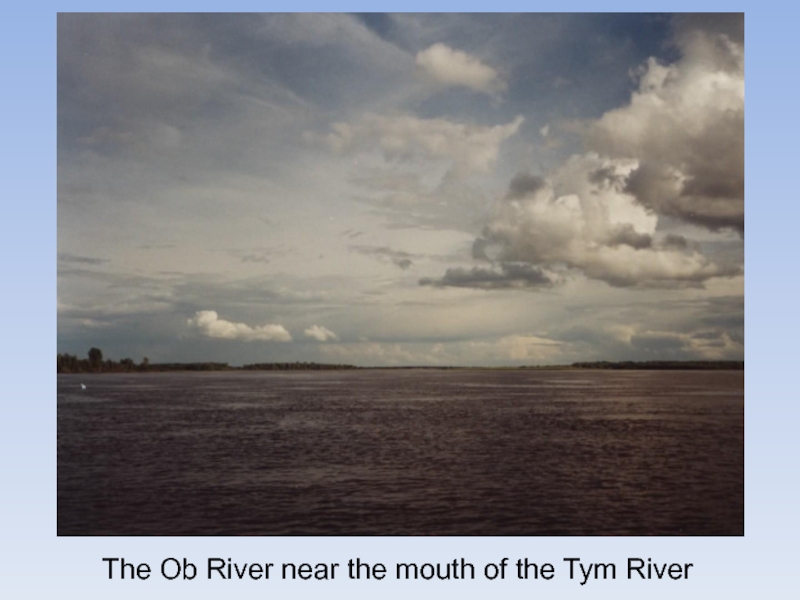
- 104. The Ob River near the mouth of the Tym River
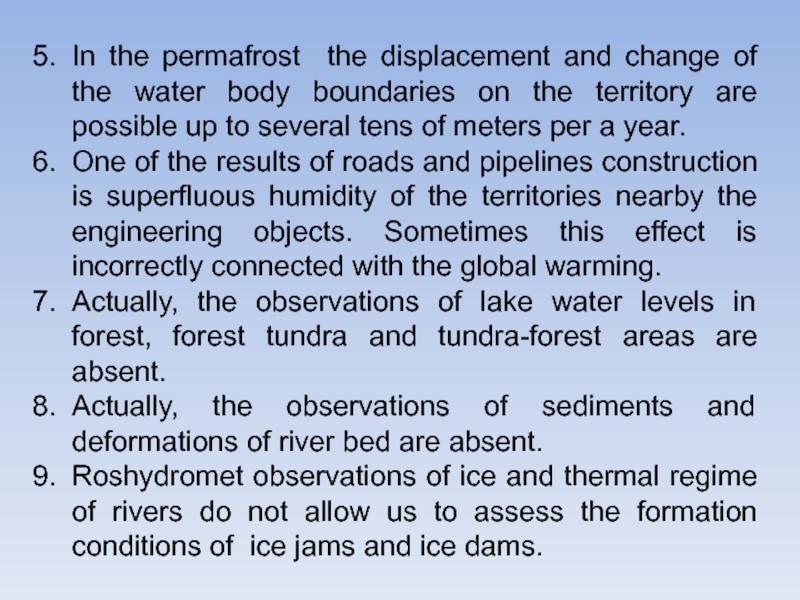
- 105. In the permafrost the displacement and change
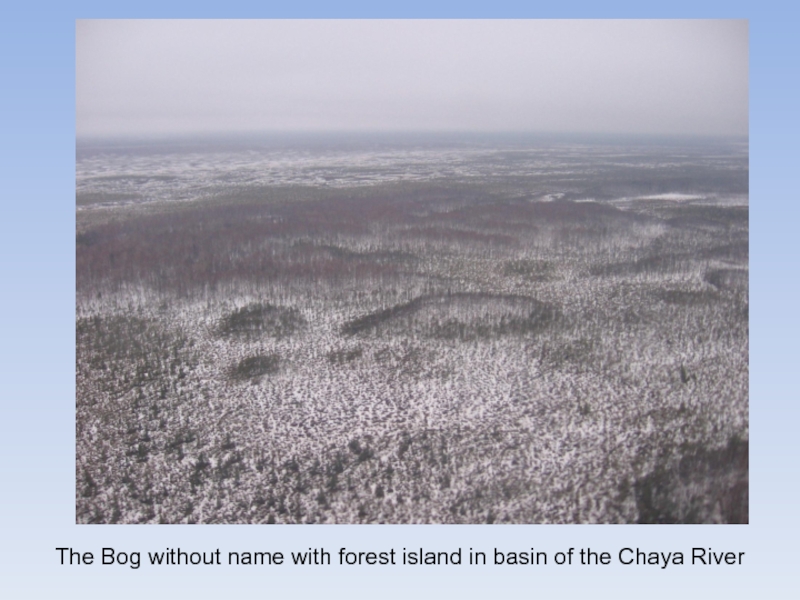
- 106. The Bog without name with forest island in basin of the Chaya River
- 107. 10. There are very serious problems with
- 108. Thanks for your attention
- 109. Скачать презентанцию
Слайды и текст этой презентации
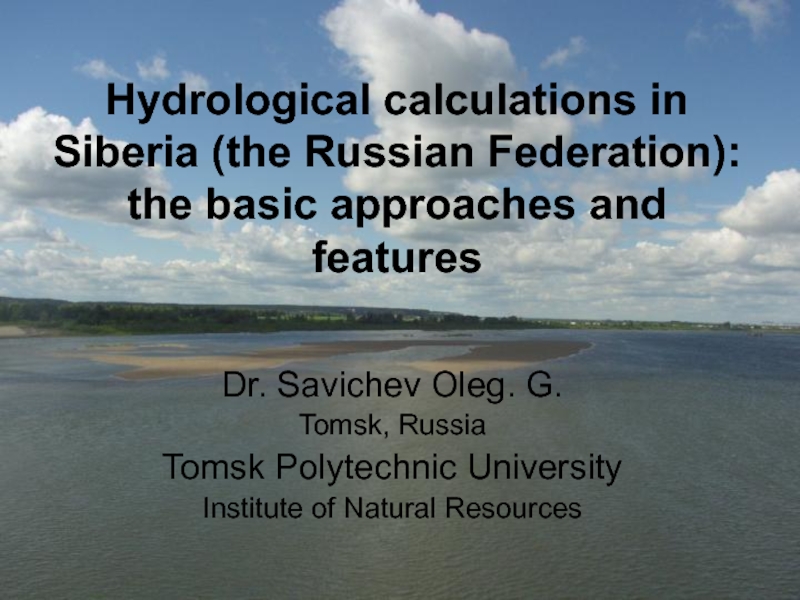
Слайд 1Hydrological calculations in Siberia (the Russian Federation): the basic approaches
and features
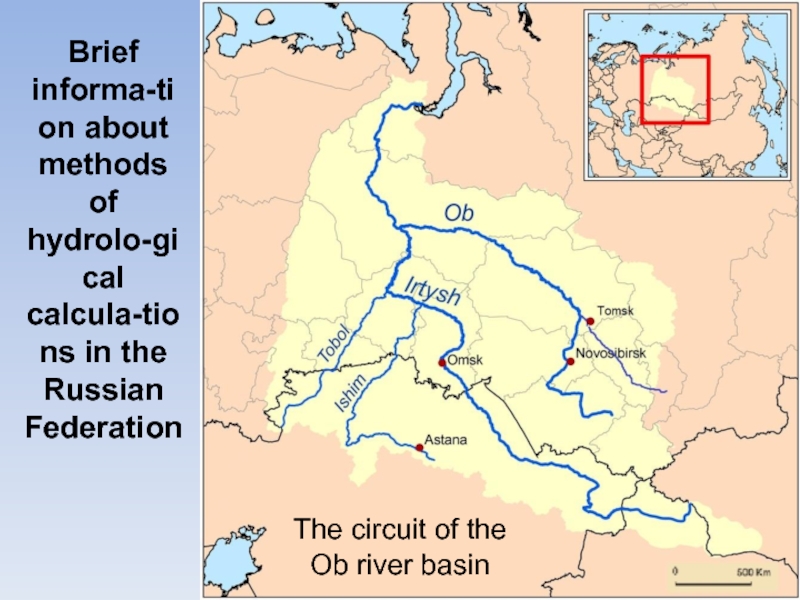
ResourcesСлайд 2Brief informa-tion about methods of hydrolo-gical calcula-tions in the Russian
Federation
The circuit of the
Ob river basin
Слайд 3Hydrological Calculations (or Engineering Hydrology) are an important part of
hydrology which connects together the methods of hydrodynamics, mathematical statistics,
probability theory, hydrochemistry, and geography.Result of this connection should become development of simple methods using which allows us to obtain parameters of a hydrological regime with the required accuracy.
Simply – does not mean badly. So – it is necessary to distinguish the key parts of researched system and the most informative parameters of their condition.
Слайд 4Usually it is enough to obtain information on limiting conditions.
But it is necessary to understand that all water systems
are always changing.For example, 20000-15000 years ago in the north and the south of Siberia there were glaciers, 15000-10000 years ago - the density of a river network strongly increased and “bogs” (marshes) appeared. Within the last 11000-8000 years the bogs are extended (about 1 mm per year upwards) and they gradually “kill” the rivers. But water in bogs is too much abundant and it should flow somewhere. Therefore, it forms new marsh rivers and lakes.
The consequences of process are shown in the pictures.
Слайд 5“Stage 1”. The main elements of the transcontinental system Snowmelt
Runoff of the last glaciation (by [Volkov, Kazmin, 2007]); a
- ice sheets and mountain-cover complexes; б - floating ice shelves; в - drained ice shelves; г - elements of runoff; д- meltwater in streams, ж – borders of basins drain systems;6 – Aral lake; 7 – Mansyiskoe (Obskoe) lake
Слайд 8“Stage 4”. Marshy valley of the Parabel River tributary,
with
the lack of stream flow in the most part of
the yearСлайд 10If we want to understand what will happen to the
water resources (in Siberia or in whole Eurasia), then how
should we study them? What time scale should be chosen? What methods of research should be used?It is possible to assume that it is necessary to develop complex models and understand hydrological processes.
But also it is necessary to carry out the geographical analysis, to cut off superfluous data, and to apply them to concrete objects.
The second direction is the basic contents of my research in the part of hydrological calculations and the geographical analysis in hydrochemistry. The basic objects of my research - the rivers and bogs in Siberia.
Слайд 11Now it is made much enough for studying hydrological processes.
But always there is a problem - the repeated invention
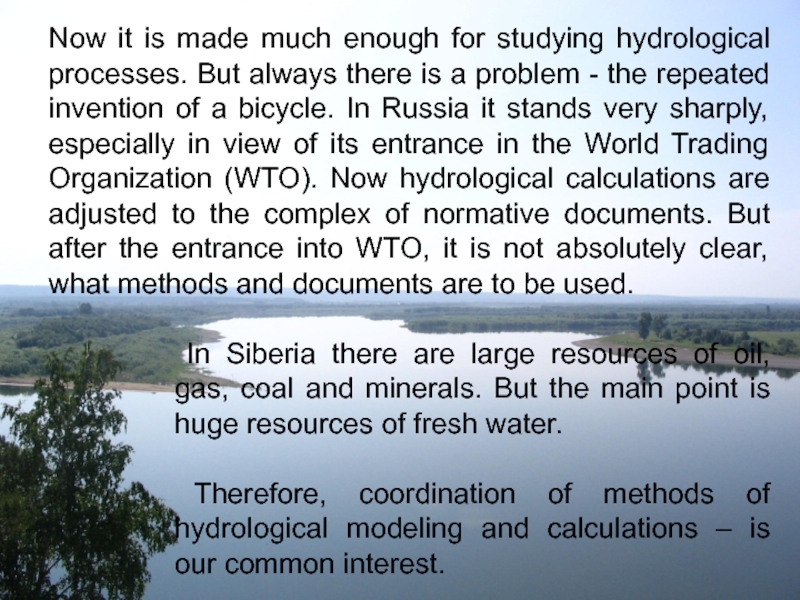
of a bicycle. In Russia it stands very sharply, especially in view of its entrance in the World Trading Organization (WTO). Now hydrological calculations are adjusted to the complex of normative documents. But after the entrance into WTO, it is not absolutely clear, what methods and documents are to be used.In Siberia there are large resources of oil, gas, coal and minerals. But the main point is huge resources of fresh water.
Therefore, coordination of methods of hydrological modeling and calculations – is our common interest.
Слайд 12Hydrology key concept is Flow – the water movement on
the Earth surface, as well as in the thickness of
soil and rock in its natural cycle. The following kinds of flow are distinguished :surface, overland, subsurface, ground flow;
rainfall, snow-melted, ice, ground flow;
river and channel flow.
The characteristics of Water Flow are:
Volume of Runoff W (m3/period);
Specific Discharge MW (l/(sec km2));
Depth of Runoff YW (mm/period).
A particular case of the runoff volume is the Water Discharge Q (m3/sec, l/sec).
1. Briefly about the methods used in Russia
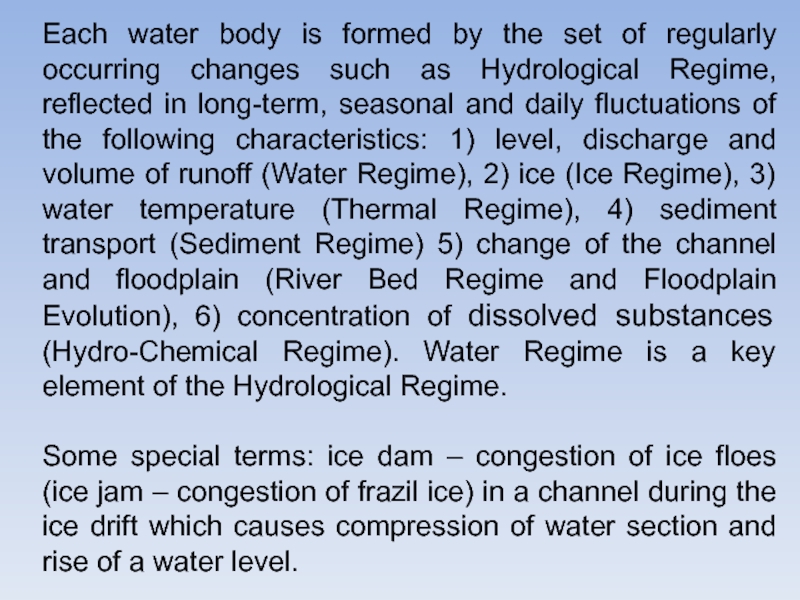
Слайд 13Each water body is formed by the set of regularly
occurring changes such as Hydrological Regime, reflected in long-term, seasonal
and daily fluctuations of the following characteristics: 1) level, discharge and volume of runoff (Water Regime), 2) ice (Ice Regime), 3) water temperature (Thermal Regime), 4) sediment transport (Sediment Regime) 5) change of the channel and floodplain (River Bed Regime and Floodplain Evolution), 6) concentration of dissolved substances (Hydro-Chemical Regime). Water Regime is a key element of the Hydrological Regime.Some special terms: ice dam – congestion of ice floes (ice jam – congestion of frazil ice) in a channel during the ice drift which causes compression of water section and rise of a water level.
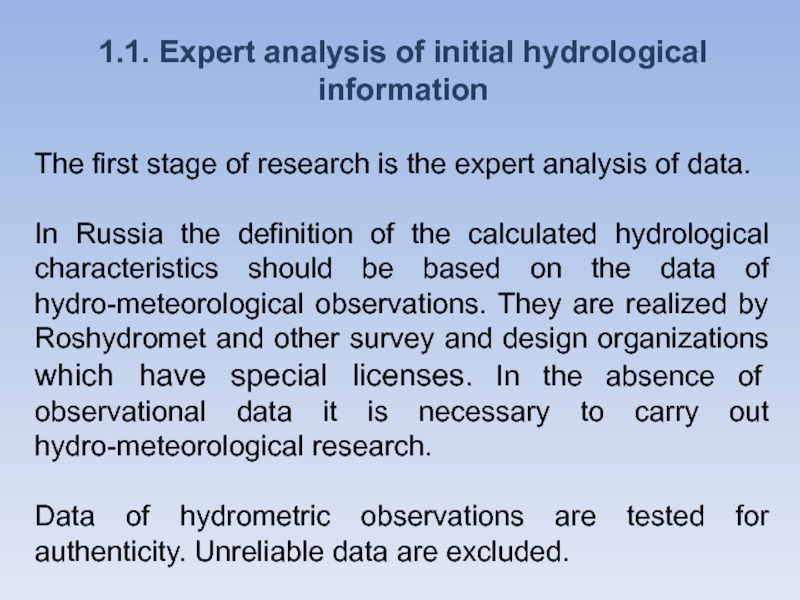
Слайд 141.1. Expert analysis of initial hydrological information
The first stage of
research is the expert analysis of data.
In Russia the definition
of the calculated hydrological characteristics should be based on the data of hydro-meteorological observations. They are realized by Roshydromet and other survey and design organizations which have special licenses. In the absence of observational data it is necessary to carry out hydro-meteorological research. Data of hydrometric observations are tested for authenticity. Unreliable data are excluded.
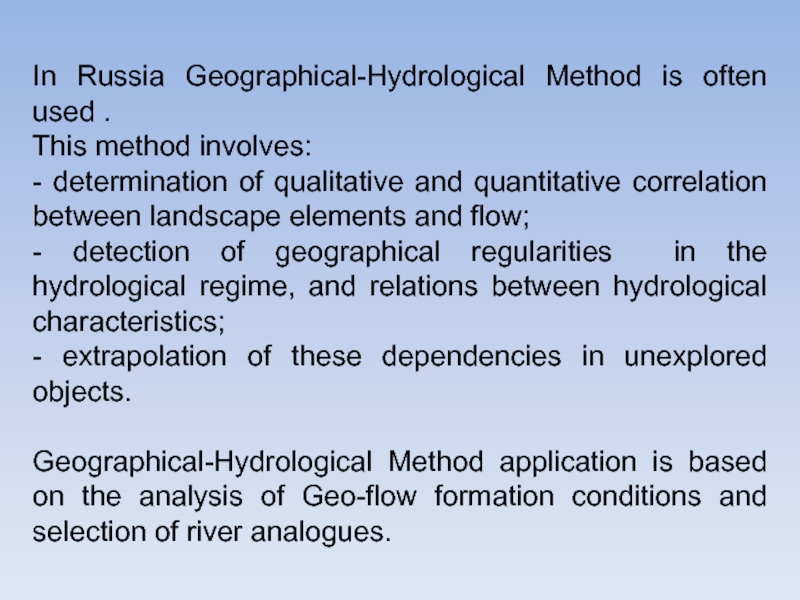
Слайд 15In Russia Geographical-Hydrological Method is often used .
This method
involves:
- determination of qualitative and quantitative correlation between landscape elements
and flow; - detection of geographical regularities in the hydrological regime, and relations between hydrological characteristics;
- extrapolation of these dependencies in unexplored objects.
Geographical-Hydrological Method application is based on the analysis of Geo-flow formation conditions and selection of river analogues.
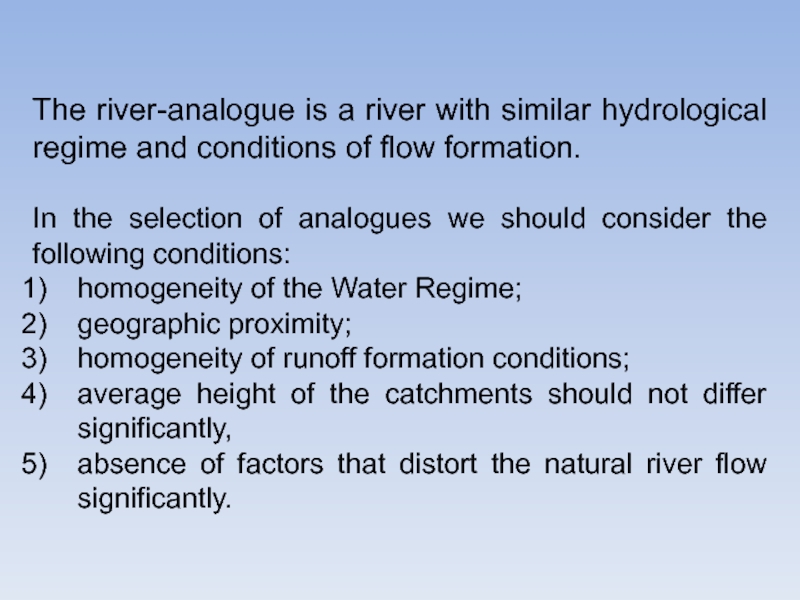
Слайд 16The river-analogue is a river with similar hydrological regime and
conditions of flow formation.
In the selection of analogues we
should consider the following conditions: homogeneity of the Water Regime;
geographic proximity;
homogeneity of runoff formation conditions;
average height of the catchments should not differ significantly,
absence of factors that distort the natural river flow significantly.
Слайд 171.2. Statistical analysis of initial hydrological information
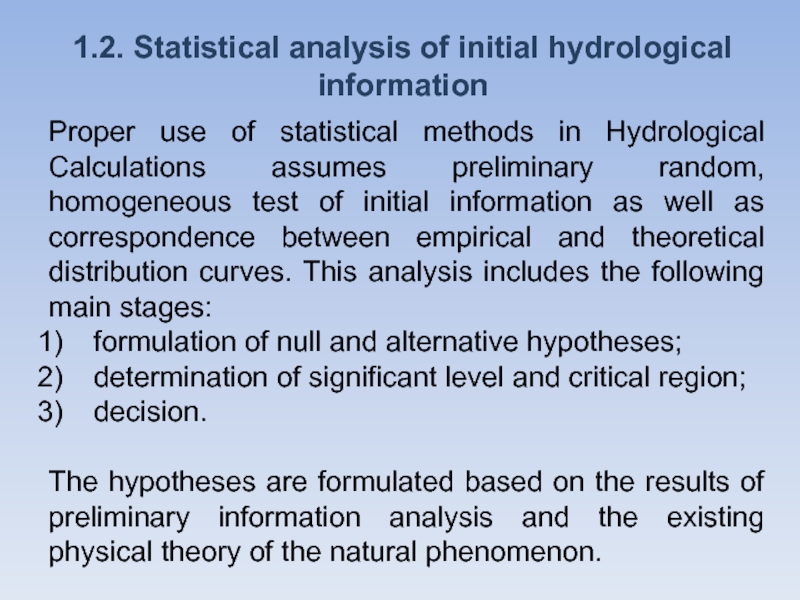
Proper use of statistical
methods in Hydrological Calculations assumes preliminary random, homogeneous test of
initial information as well as correspondence between empirical and theoretical distribution curves. This analysis includes the following main stages:formulation of null and alternative hypotheses;
determination of significant level and critical region;
decision.
The hypotheses are formulated based on the results of preliminary information analysis and the existing physical theory of the natural phenomenon.
Слайд 181.3. Choice of a design scheme
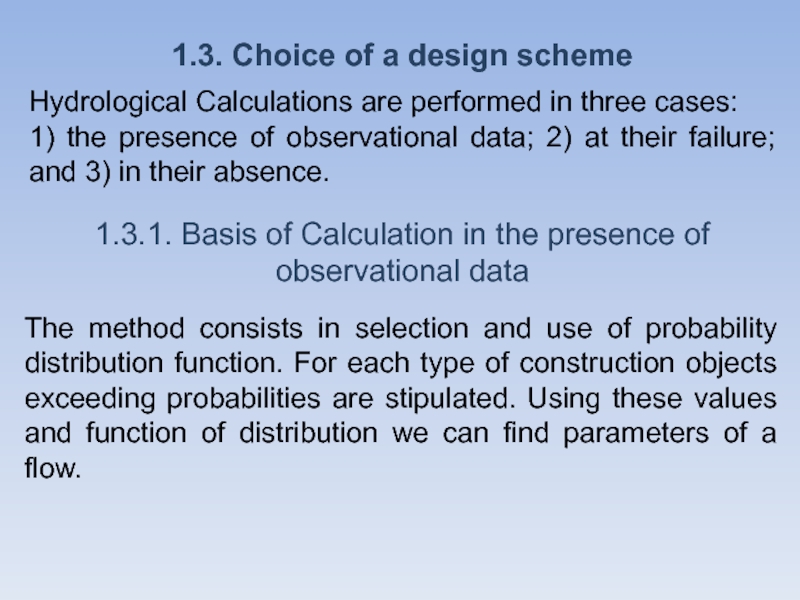
Hydrological Calculations are performed in
three cases:
1) the presence of observational data; 2) at
their failure; and 3) in their absence.1.3.1. Basis of Calculation in the presence of observational data
The method consists in selection and use of probability distribution function. For each type of construction objects exceeding probabilities are stipulated. Using these values and function of distribution we can find parameters of a flow.
Слайд 19Selection of distribution function type is made on the basis
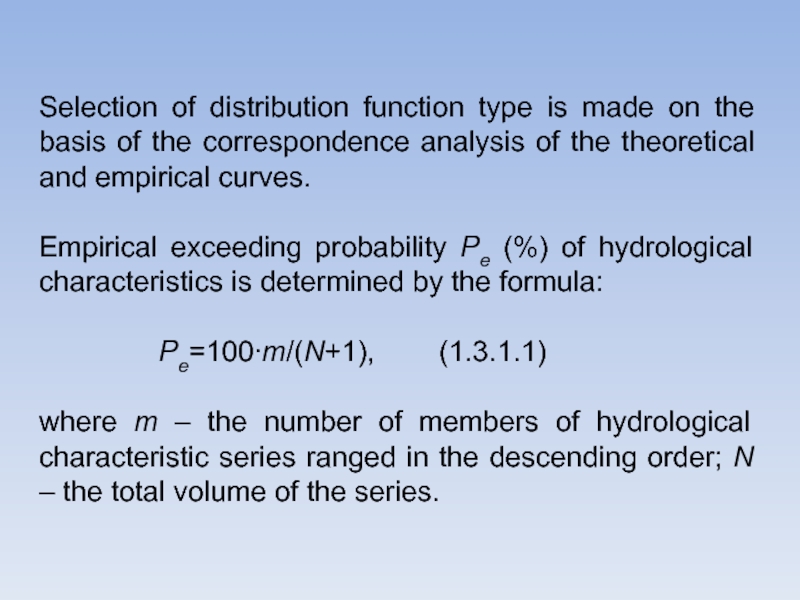
of the correspondence analysis of the theoretical and empirical curves.
Empirical exceeding probability Pe (%) of hydrological characteristics is determined by the formula:
Рe=100∙m/(N+1), (1.3.1.1)
where m – the number of members of hydrological characteristic series ranged in the descending order; N – the total volume of the series.
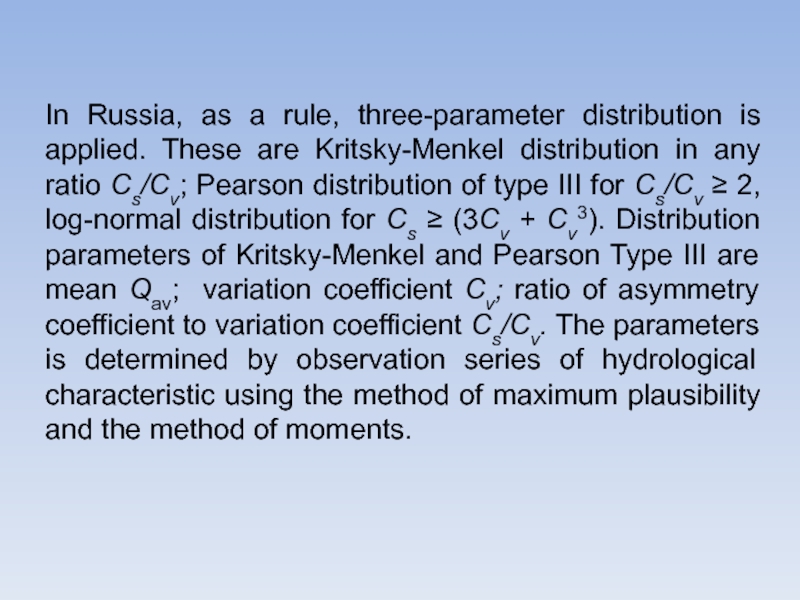
Слайд 20In Russia, as a rule, three-parameter distribution is applied. These
are Kritsky-Menkel distribution in any ratio Cs/Cv; Pearson distribution of
type III for Cs/Cv 2, log-normal distribution for Cs (3Cv + Cv3). Distribution parameters of Kritsky-Menkel and Pearson Type III are mean Qav; variation coefficient Cv; ratio of asymmetry coefficient to variation coefficient Cs/Cv. The parameters is determined by observation series of hydrological characteristic using the method of maximum plausibility and the method of moments.Слайд 21At the present the method of moments is often used
:
where ki =Qi/Qcp; Cv* and Cs* – biased estimates of
variation and asymmetry coefficients, respectively., (1.3.1.2)
, (1.3.1.3)
, (1.3.1.4)
Слайд 22When Cv*
to determine according to the formulas (1.3.1.3; 1.3.1.4) without the
introduction of bias amendments. Otherwise, the variation Cv and asymmetry Cs coefficients are determined by formulas:Сv=(a1+а2/N)+(a3+a4/N) Cv*+(a5+a6/N)∙Cv*2, (1.3.1.5)
Cs=(b1+b2/n)+(b3+b4/n)∙Cs*+(b5+b6/n)∙Cs*2, (1.3.1.6)
where a1, ..., а6; b1, …, b6 – coefficients determined for Pearson distribution of Type III on special tables in accordance with autocorrelation coefficient r(1). Biased estimate of autocorrelation coefficient r*(1) is determined by the formula (1.3.1.7), unbiased estimate is done according to the formula (1.3.1.8):
Слайд 24The period of observation should be sufficient, if the period
is representative and the relative standard error of calculated hydrological
characteristic does not exceed 10% for the annual and seasonal runoff and 20% for the maximum and minimum flows.The standard error of average is determined according to the formulas (1.3.1.9) or (1.3.1.10), the standard error of the variation coefficient for Cs = 2Cv – by the formula (1.3.1.11).
, r<0.5. (1.3.1.9)
, r ≥ 0.5.
(1.3.1.10)
Слайд 25, (1.3.1.11)
where N – volume of observations; r –
autocorrelation coefficient.
If the relative standard error is more than the
specified limits and the period of observation is not representative, it is necessary to use the method of hydrological characteristics determining at insufficient observational data.Слайд 261.3.2. Basis of the Calculation of insufficient observational data
In case
of observational data insufficiency the calculations are realized by the
extension of existing short series involving observational data of longer analogue rivers (on the same river or others).The methods of analogue provides:
1) natural zoning analysis of the study area and the choice of possible analogues in the area with similar hydrological and physiographic conditions;
2) calculation of the matrix of paired correlation coefficients;
Слайд 273) regression analysis for the following conditions:
N' (6-10);
R
Rкр (0.7);
R/R Акр,
k/k Bкр,
where N' – the
number of joint years; R – coefficient of pair or multiple correlation;
k – coefficient of regression;
k – standard error of regression coefficient;
Rcr – critical value of the pair or multiple correlation;
Аcr(2), Bcr(2) – critical values of ratios R/R and k/k.
Слайд 281.3.3. Basis of the Calculation in the absence of observational
data
When observational data are not available, the distribution parameters and
calculated values are determined by using the following basic methods:1) water balance;
2) hydrological analogy;
3) averaging in the homogeneous region;
4) construction of contour maps;
5) construction of regional dependencies of flow characteristics and physical and geographical factors of catchment or flow.
Слайд 291.4. Calculations of Water Flow
1.4.1. Annual runoff
1.4.1.1. Determination in the
presence of observational data
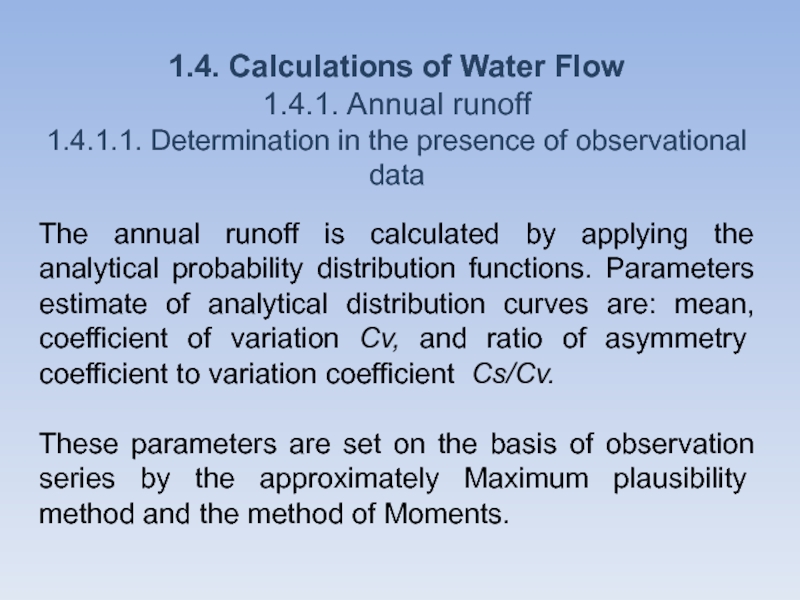
The annual runoff is calculated by applying
the analytical probability distribution functions. Parameters estimate of analytical distribution curves are: mean, coefficient of variation Cv, and ratio of asymmetry coefficient to variation coefficient Cs/Cv. These parameters are set on the basis of observation series by the approximately Maximum plausibility method and the method of Moments.
Слайд 301.4.1.2. Determination of insufficiency of observational data
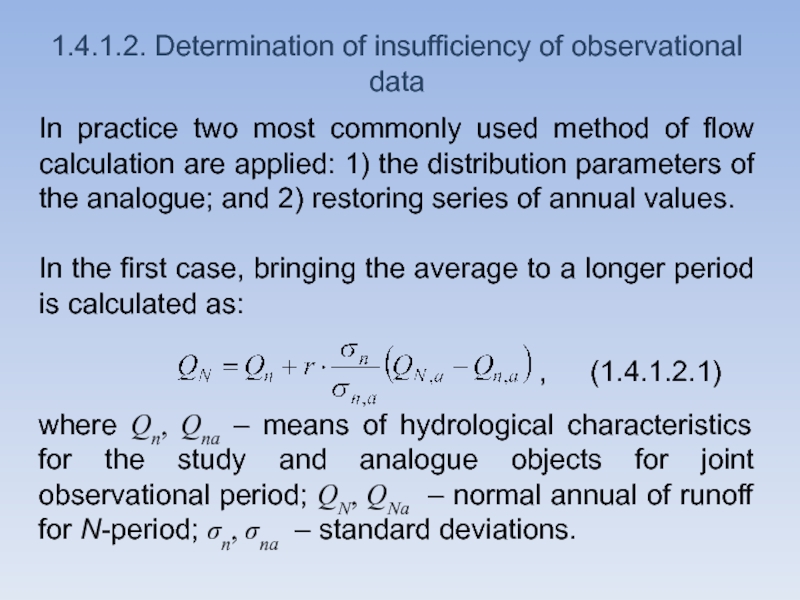
In practice two most
commonly used method of flow calculation are applied: 1) the
distribution parameters of the analogue; and 2) restoring series of annual values.In the first case, bringing the average to a longer period is calculated as:
, (1.4.1.2.1)
where Qn, Qna – means of hydrological characteristics for the study and analogue objects for joint observational period; QN, QNa – normal annual of runoff for N-period; sn, sna – standard deviations.
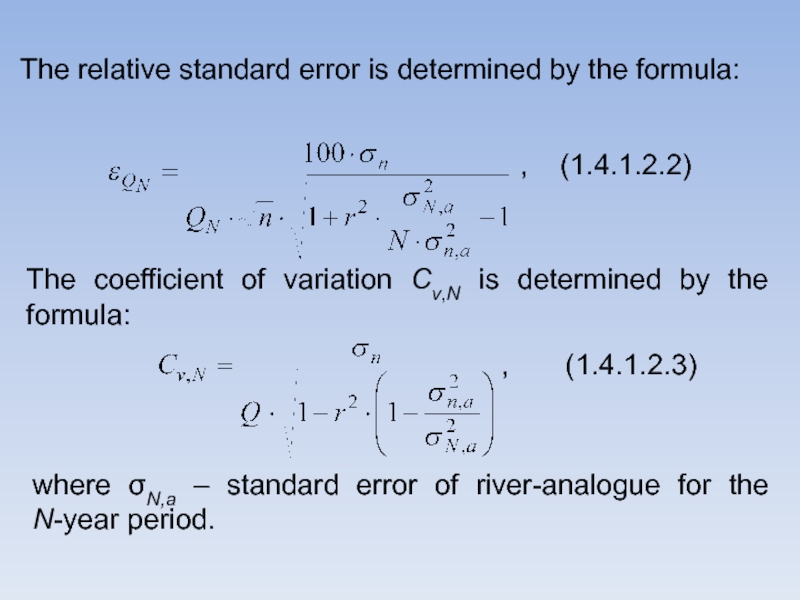
Слайд 31The relative standard error is determined by the formula:
, (1.4.1.2.2)
The
coefficient of variation Cv,N is determined by the formula:
,
(1.4.1.2.3)where N,a – standard error of river-analogue for the N-year period.
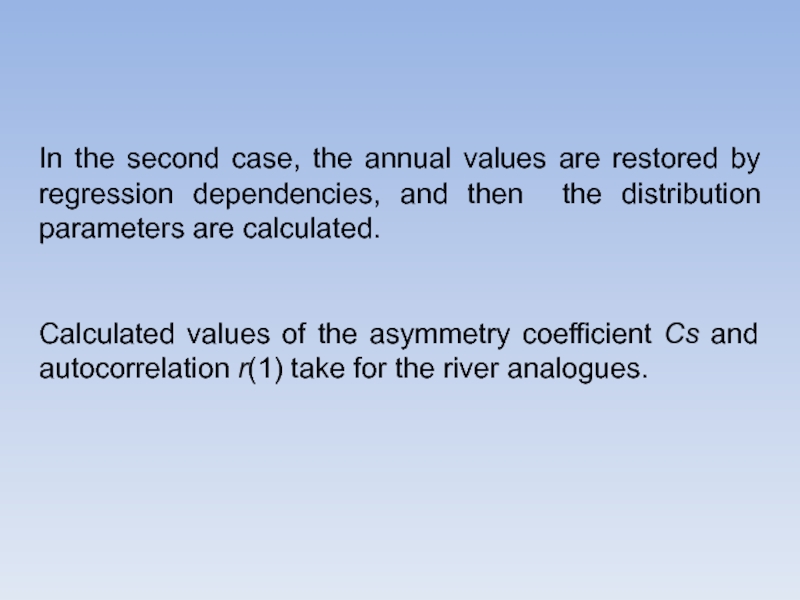
Слайд 32In the second case, the annual values are restored by
regression dependencies, and then the distribution parameters are calculated.
Calculated
values of the asymmetry coefficient Cs and autocorrelation r(1) take for the river analogues.Слайд 33The parameters are determined by: 1) river analogues, and 2)
empirical dependencies of climate parameters and other factors.
In the
first method, the annual runoff for the gravity center of the flat part of the catchment is determined by linear interpolation between the flow contour. The average annual value of mountain river runoff is determined by the district flow dependencies on the average height of the catchment. The coefficient of variation Cv is determined by the map of isolines or the regional empirical formulas. In the second method the annual runoff is calculated as the sum of runoff depths for seasonal components during homogeneous periods.1.4.1.3. Determination in the absence of observational data
Слайд 341.4.2. Maximum flow
1.4.2.1. Determination in the presence of observational data
Calculated
characteristics of the maximum river flow in snow melt flood
and rainfall flood are determined as the annual runoff. Specificity of the calculations is concluded in the way of initial series forming and the use of amendments in some cases.Due to impossibility of dividing the maximum discharges of snow melt flood and rain flood it is allowed plotting the common curves of distribution.
Слайд 35Characteristics of peak flow, as in the case of calculating
annual runoff, are determined on the basis of regression analysis:
1) the parameters of the analogue distribution; and
2) Restored series of values by years.
1.4.2.2. Determination in insufficiency of observational data
Слайд 36Calculation formulas of maximum charges are generally divided into three
main groups:
Reducing formulas reflect a decrease in runoff modulus
with increasing catchment area; Limit Intensity formulas connect the maximum flow Qmax with the greatest intensity of water run-out from the snow cover or rain for the travel time, and
3) Volumetric formulas characterize the relation between maximum charges and flow volume or flow depth, and with duration of floods.
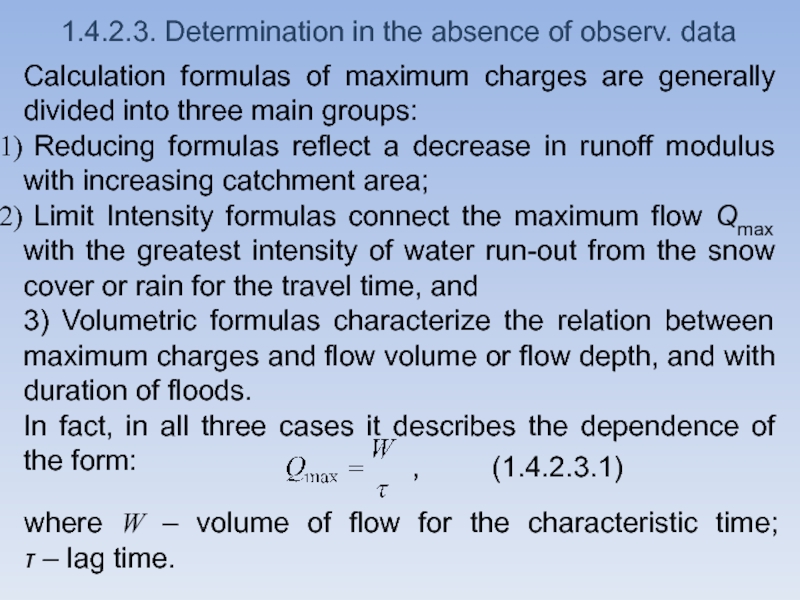
In fact, in all three cases it describes the dependence of the form:
1.4.2.3. Determination in the absence of observ. data
, (1.4.2.3.1)
where W – volume of flow for the characteristic time; – lag time.
Слайд 371.4.2.3.1. Snow Melt Flood
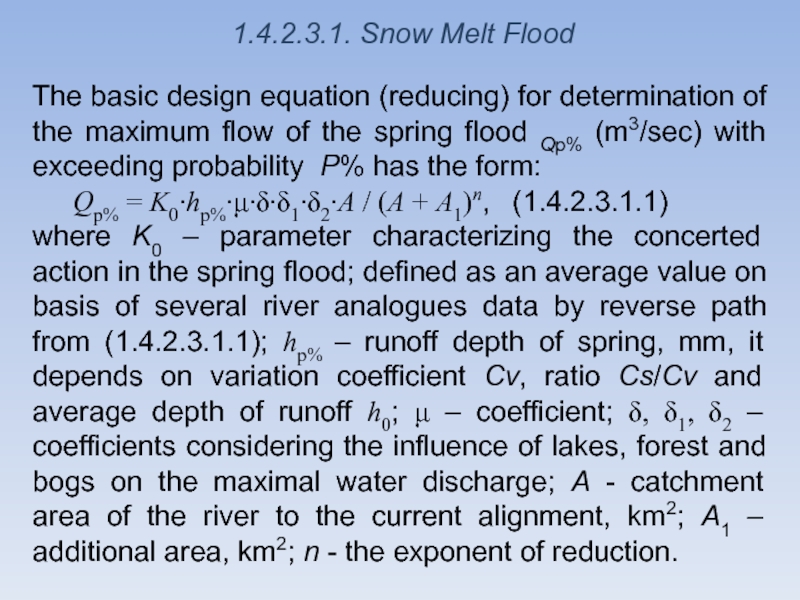
The basic design equation (reducing) for determination
of the maximum flow of the spring flood Qр% (m3/sec)
with exceeding probability Р% has the form:Qр% = K0∙hp%∙∙∙1∙2∙A / (A + A1)n, (1.4.2.3.1.1)
where K0 – parameter characterizing the concerted action in the spring flood; defined as an average value on basis of several river analogues data by reverse path from (1.4.2.3.1.1); hр% – runoff depth of spring, mm, it depends on variation coefficient Cv, ratio Cs/Cv and average depth of runoff h0; – coefficient; , 1, 2 – coefficients considering the influence of lakes, forest and bogs on the maximal water discharge; A - catchment area of the river to the current alignment, km2; А1 – additional area, km2; n - the exponent of reduction.
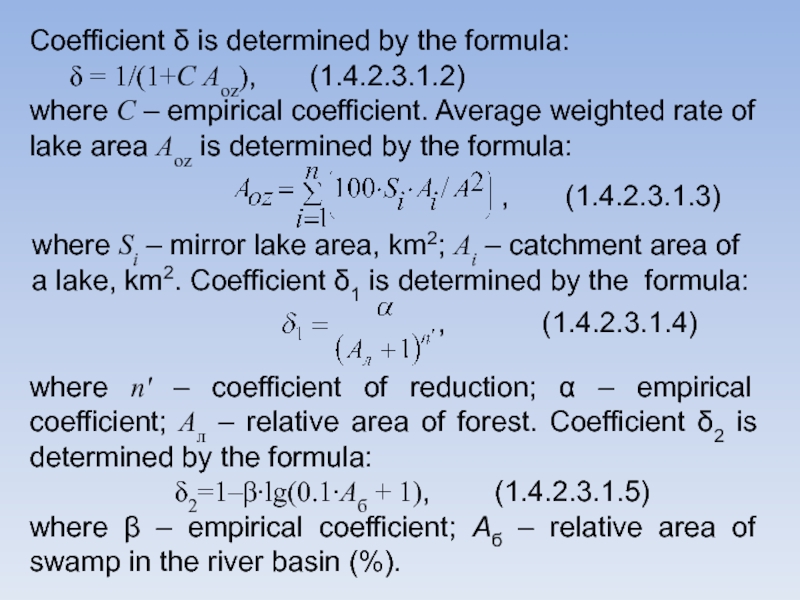
Слайд 38Coefficient is determined by the formula: = 1/(1+С
Aоz), (1.4.2.3.1.2)
where С – empirical coefficient. Average weighted rate of
lake area Aоz is determined by the formula:, (1.4.2.3.1.3)
where Si – mirror lake area, km2; Ai – catchment area of a lake, km2. Coefficient 1 is determined by the formula:
, (1.4.2.3.1.4)
where n' – coefficient of reduction; – empirical coefficient; Aл – relative area of forest. Coefficient 2 is determined by the formula:
2=1–∙lg(0.1∙Aб + 1), (1.4.2.3.1.5)
where – empirical coefficient; Aб – relative area of swamp in the river basin (%).
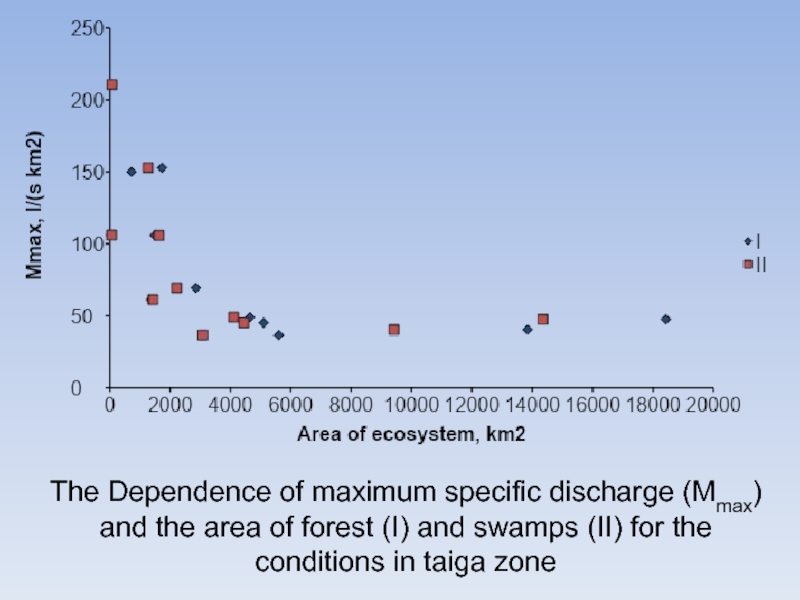
Слайд 39The Dependence of maximum specific discharge (Мmax) and the area
of forest (I) and swamps (II) for the conditions in
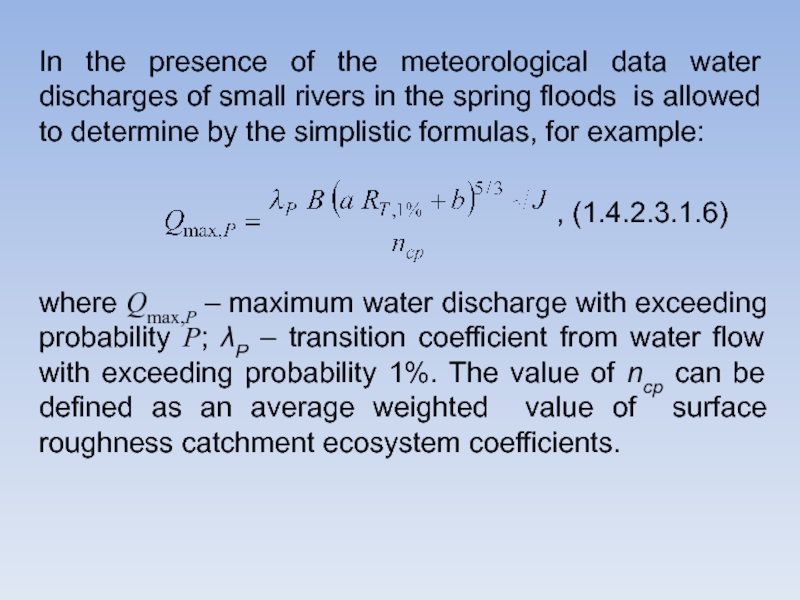
taiga zoneСлайд 40In the presence of the meteorological data water discharges of
small rivers in the spring floods is allowed to determine
by the simplistic formulas, for example:, (1.4.2.3.1.6)
where Qmax,P – maximum water discharge with exceeding probability Р; Р – transition coefficient from water flow with exceeding probability 1%. The value of ncp can be defined as an average weighted value of surface roughness catchment ecosystem coefficients.
Слайд 421.4.2.3.2. Rainfall Flood
Calculation formula type for determination of the maximum
flow in rain floods is chosen taking into account the
catchment area and the availability of analogue (table 1.4.2.3.2.1).Слайд 43Table 1.4.2.3.2.1. The application of design formulas to determine the
maximum flow of rain flood with given exceeding probability
Слайд 44The design formula of the type I for determination Qр%
in the presence of one or more river analogues has
the following form:Qр% = qр%,a∙м∙(∙2/а∙2а)∙A, (1.4.2.3.2.1)
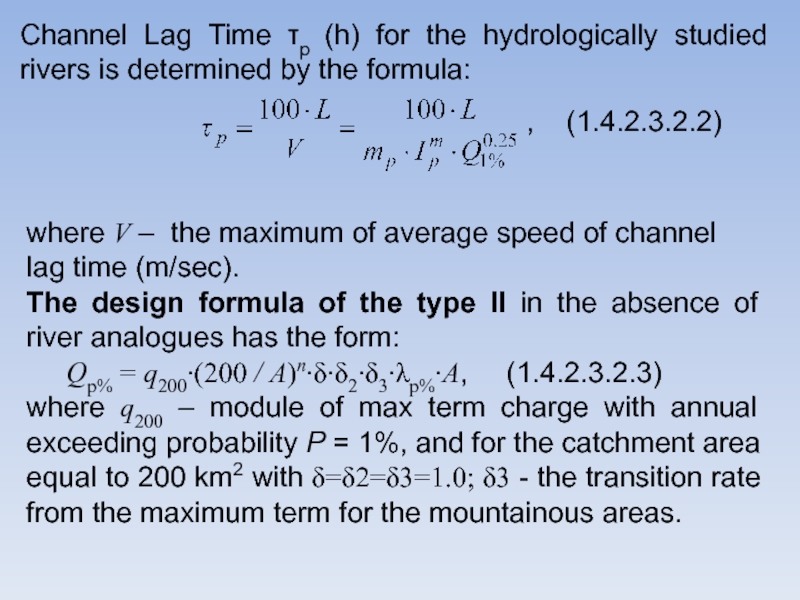
where qр%,a – specific max term charge of river analogue with estimated exceeding probability Р% (m3/sec km2); м – coefficient allowing for the reduction of the maximum runoff module of rainfall flood (q1%) with increase of catchment area (A, km2) or channel lag time (р, minute); it is calculated depending on the value ф (correlation of catchment form coefficients for the study river and the river analogue).
Слайд 45Channel Lag Time р (h) for the hydrologically studied rivers
is determined by the formula:
, (1.4.2.3.2.2)
where V – the maximum of
average speed of channel lag time (m/sec).The design formula of the type II in the absence of river analogues has the form:
Qр% = q200∙(200 / А)n∙∙2∙3∙р%∙A, (1.4.2.3.2.3)
where q200 – module of max term charge with annual exceeding probability P = 1%, and for the catchment area equal to 200 km2 with - the transition rate from the maximum term for the mountainous areas.
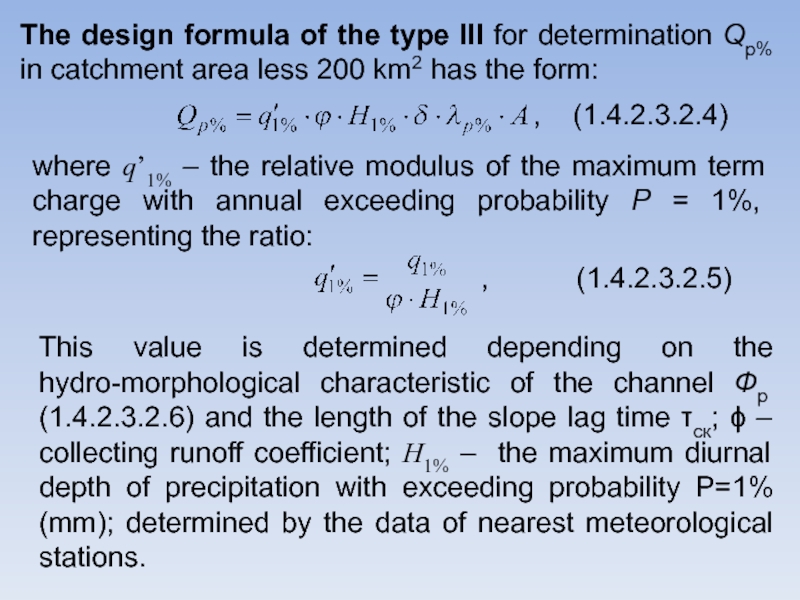
Слайд 46The design formula of the type III for determination Qр%
in catchment area less 200 km2 has the form:
, (1.4.2.3.2.4)
where q’1%
– the relative modulus of the maximum term charge with annual exceeding probability P = 1%, representing the ratio:, (1.4.2.3.2.5)
This value is determined depending on the hydro-morphological characteristic of the channel Фp (1.4.2.3.2.6) and the length of the slope lag time ск; – collecting runoff coefficient; H1% – the maximum diurnal depth of precipitation with exceeding probability P=1% (mm); determined by the data of nearest meteorological stations.
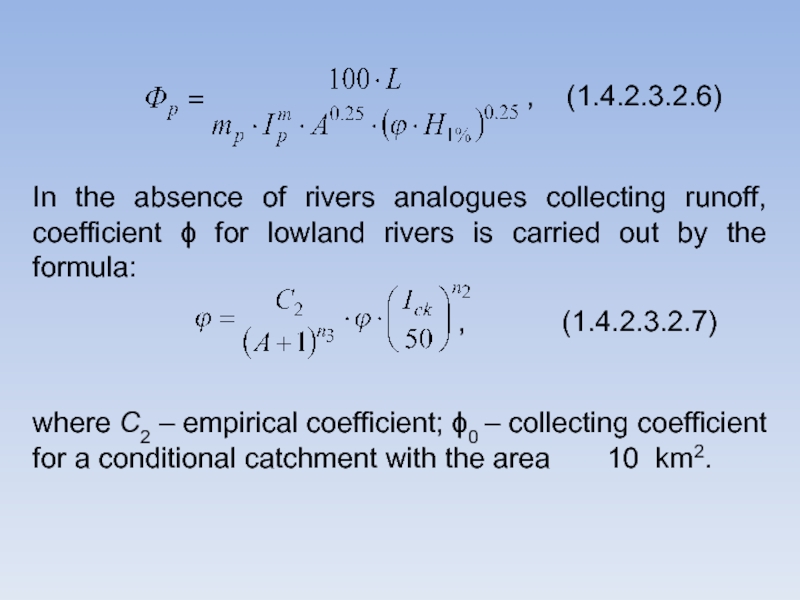
Слайд 47, (1.4.2.3.2.6)
In the absence of rivers analogues collecting runoff, coefficient
for lowland rivers is carried out by the formula:
,
(1.4.2.3.2.7)where С2 – empirical coefficient; 0 – collecting coefficient for a conditional catchment with the area 10 km2.
Слайд 491.4.3. Minimum runoff
1.4.3.1. Determination in the presence of observational data
Determination
of the minimum water discharges is carried out as annual
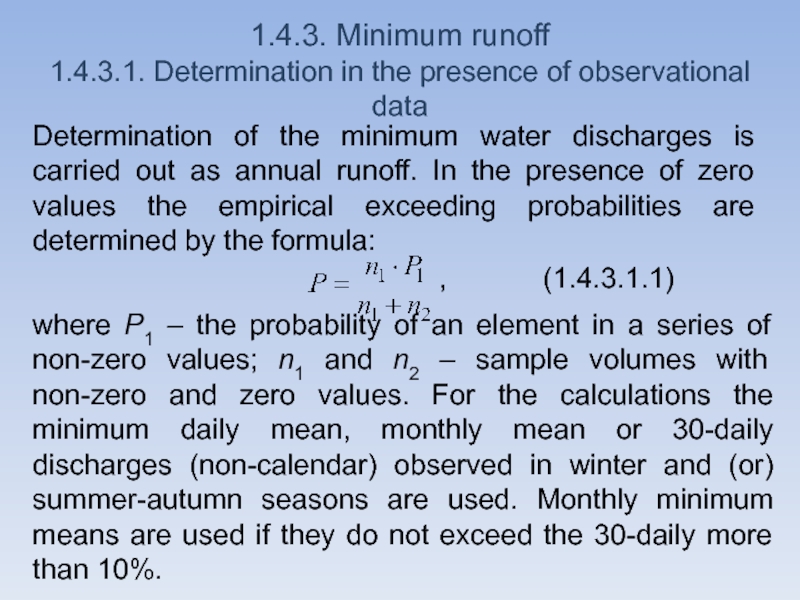
runoff. In the presence of zero values the empirical exceeding probabilities are determined by the formula:, (1.4.3.1.1)
where P1 – the probability of an element in a series of non-zero values; n1 and n2 – sample volumes with non-zero and zero values. For the calculations the minimum daily mean, monthly mean or 30-daily discharges (non-calendar) observed in winter and (or) summer-autumn seasons are used. Monthly minimum means are used if they do not exceed the 30-daily more than 10%.
Слайд 511.4.3.2. Determination in insufficiency of observational data
The calculations are the
same as in the case of runoff rate. Specificity is
the preparation of input data.1.4.3.3. Determination in the absence of observational data
Minimum water discharge in large and medium rivers is determined by interpolation between points of observation taking into account lateral inflow data and meteorological research. Minimum flow of small rivers QР% (m3/s) is calculated from:
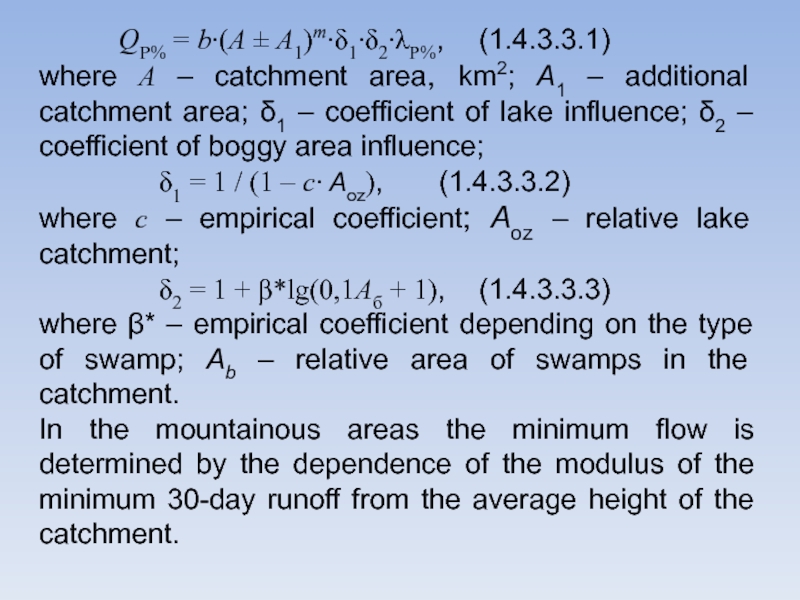
Слайд 52 QР% = b∙(A ± A1)m∙1∙2∙Р%, (1.4.3.3.1)
where А – catchment area,
km2; А1 – additional catchment area; 1 – coefficient of
lake influence; 2 – coefficient of boggy area influence;1 = 1 / (1 – с∙ Aоz), (1.4.3.3.2)
where с – empirical coefficient; Aоz – relative lake catchment;
2 = 1 + *lg(0,1Aб + 1), (1.4.3.3.3)
where * – empirical coefficient depending on the type of swamp; Ab – relative area of swamps in the catchment.
In the mountainous areas the minimum flow is determined by the dependence of the modulus of the minimum 30-day runoff from the average height of the catchment.
Слайд 541.4.4. Annual distribution of stream flow
1.4.4.1. Determination in the presence
of observational data
Determination of calculated calendar annual distribution of flow
with duration of observation series n equal to 15 years and more, is carried out by the following methods: compound;
real year;
average flow distribution for the years of the characteristic scales of water content.
The calculations of the distribution are made by water years, usually beginning from April.
Слайд 55When the observation period n is from 15 to 30
years, three year groups are distinguished:
- wet years
(P <33.3%);- average water years (33.3% P 66.7%);
- dry years (P> 66.7%).
For the duration of observations over 30 years, five groups are distinguished:
- very wet years (P 16.7%);
- wet years (16.7% P 33.3%);
- average water years (33.3% P 66.7%);
- dry years (66.7 P 83.3%);
- very dry years (P>83.3%).
Слайд 56The simplest method is the Method of Average Flow Distributions
for water year. It is based on the calculation of
average relative distribution of monthly runoff.These distributions are typical for each group of characteristic of water flow years. For the calculated distribution it is necessary to multiply the monthly relative flow and annual runoff by the concrete exceeding probability.
Слайд 57The snow melt flood and winter low water on the
Tugoyakovka River (the tributary of the Tom River)
Слайд 581.4.4.2. Determination in insufficiency of observational data
The short series of
the observed runoff values for water year, seasons and months
are extended to a long period. Further calculations are carried out in the presence of observational data.1.4.4.3. Determination in the absence of observational data
In the absence of hydrometric observational data the annual runoff distribution is determined by the river analogues according to the district schemes and regional dependencies.
Слайд 591.5. Calculations of the characteristic water levels
1.5.1. Determination in the
presence of observational data
Highest water levels are determined by analytical
distribution curve of exceeding probability during the period of long-term observations. At the heterogeneity of the highest water levels, empirical distribution curves can be used. If it is necessary, the calculated levels are transferred up or down the river in one of the three ways: 1) use of water discharge curves Q = f(H); 2) use of relation curves between corresponding water levels; and 3) use of longitudinal profile of water surface taking into account its slope at high water.
Слайд 60Transfer of water levels on the longitudinal profile of water
surface is produced within small areas along the lengths (1-3
km). If the highest levels occur in the ice period, their transfer is performed by the dependence Q = f(H) for the open channel and water flow calculated as:, (1.5.1.1)
where Qр% – water discharge; kQ - winter rate.
Determination of maximum levels of lake water is carried out by exceeding probability level distribution curves using the same method as for the rivers.
Слайд 611.5.2. Determination in insufficiency of observational data
Extrapolation of empirical curve
of maximal levels is performed by using analytical functions of
the probability distribution of the water discharges.Calculated water levels of lakes are found by extrapolating the analytical probability curve of water volumes V in the lake. Coordinates of the dependence V = f(H) set during the survey.
Слайд 621.5.3. Determination in the absence of observational data
Estimated highest
water levels is performed by the curve Q = f(H)
using the water discharge QP%. Discharge curves are plotted by the formula:, (1.5.3.1)
where – area of channel or floodplain cross-section for level Н, m2; п – roughness coefficient, s/m0.33; h - average depth of water in the channel or floodplain, m; I – slope of the water surface. Curves = f(H) and h = f(H) are plotted by the results of measurements. The coefficient n and slope I are found from special tables or they are measured.
Слайд 63For determination of the highest water levels in the case
of ice dams and jams, preliminary special research is required.
The possibility of ice dam formation is defined by the following characteristics: 1) freezing for the conditions of moving of the ice cover upstream (characteristic of the rivers that flow from south to north, or go from the mountains to the plain); 2) the fracture of the longitudinal profile with a sharp decrease in the mouth of the slope, the presence of a channel narrowing, a sharp turn, islands; 3) upstream slope of the water surface is more 0.05 ‰; 4) intensive and prolonged (6 days or more) frazil ice drift (flow from deep lakes and reservoirs; 5) large autumn water flow (specific discharge is more 3 l/s∙km2).Слайд 64The highest level HZ.р% of ice dam (jam) is calculated
by the formula:
, (1.5.3.2)
where – coefficient of ice dam
or ice jam; IQZP%, hQZP% and HQZP%– slope (‰), depth of the river (m) and water level (m) for discharge QZ,P% and ice-free channel.The highest water levels in the movements of the ice are estimated by the curve Q=f(H) through the calculated discharges using the formula:
Q`P% =QP% / KQ, (1.5.3.3)
where – ratio coefficient of water discharges in the ice drift and at the maximum of spring flood QP%; KQ – coefficient characterizing the change in the hydraulic characteristics of water flow due to ice. These coefficients are determined by the Method of Analogy.
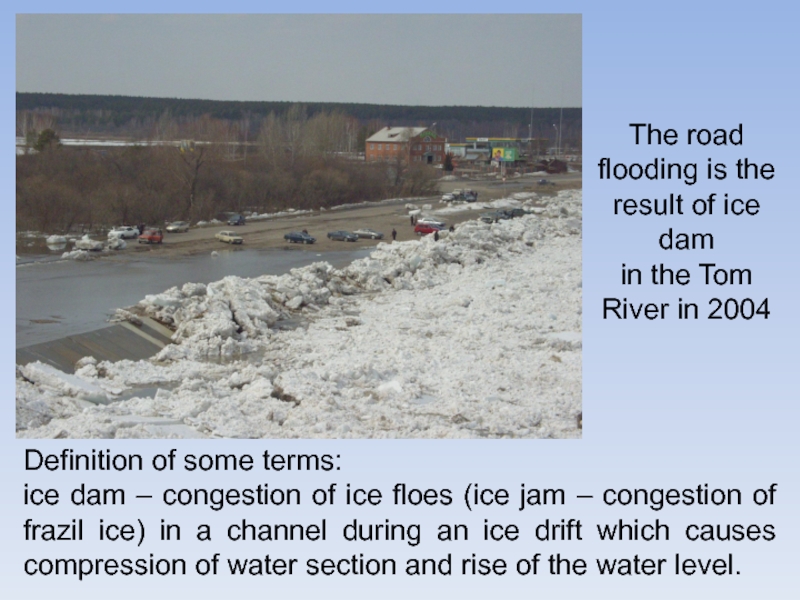
Слайд 65The road flooding is the result of ice dam in
the Tom River in 2004
Definition of some terms:
ice
dam – congestion of ice floes (ice jam – congestion of frazil ice) in a channel during an ice drift which causes compression of water section and rise of the water level.Слайд 66To calculate the maximum water levels of flow-through lakes in
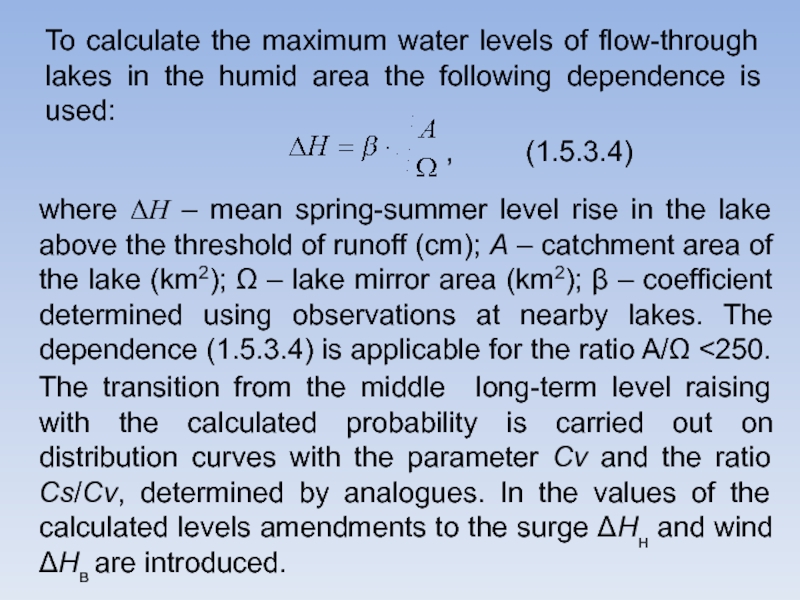
the humid area the following dependence is used:
, (1.5.3.4)
where DH
– mean spring-summer level rise in the lake above the threshold of runoff (cm); A – catchment area of the lake (km2); – lake mirror area (km2); – coefficient determined using observations at nearby lakes. The dependence (1.5.3.4) is applicable for the ratio A/ <250. The transition from the middle long-term level raising with the calculated probability is carried out on distribution curves with the parameter Cv and the ratio Cs/Cv, determined by analogues. In the values of the calculated levels amendments to the surge Hн and wind Hв are introduced.Слайд 67The Tom' River (tributary of the Ob River) has a
direction of current from the south to the north. In
the south (mountains of the Shoria and the Kuznetsky Alatau) the most part of water flow is formed. It is the reason of natural ice jams and flooding at Tomsk.In the1950-1980’s in the channel of the Tom' River sands and gravels were extracted. Therefore, bottom depth of the Tom River decreased 2-2.5 m. The probability of flooding decreased also.
In the 1980’s extraction of gravel in the channel of the Tom' River stopped. But near Tomsk some dangerous situation is formed.
1.5.4. An example of calculations of water level in the ice dam
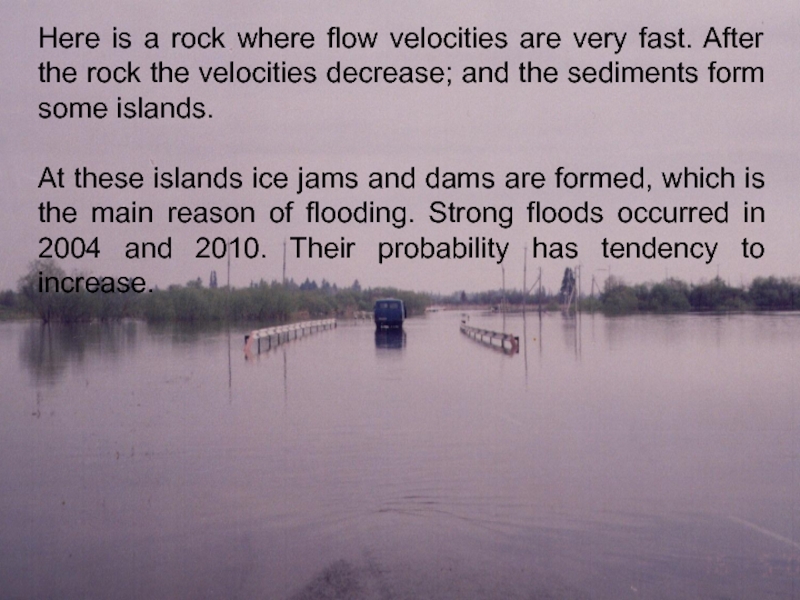
Слайд 68Here is a rock where flow velocities are very fast.
After the rock the velocities decrease; and the sediments form
some islands.At these islands ice jams and dams are formed, which is the main reason of flooding. Strong floods occurred in 2004 and 2010. Their probability has tendency to increase.
Слайд 69Conditions of ice dam and ice jam formation on the
Tom' River near Tomsk city
The south part of Tomsk city
Rocky
output in channelWide channel
Слайд 70Cross-section profile of the Tom River near Tomsk up the
utility bridge in 12.03.2010; I – water; II – frazil
ice; III – ice (it is an initial stage of ice dam and jam)Слайд 71Schematic profile of the Tom River under the conditions: Qp=7071 m3/sec;
=0.411; Кwint=0.41
Normal level
Слайд 72The ice dam and water entrance on the flood-plain
upstream Tomsk
in April, 2010 (beginning of flooding)
Слайд 73The ice dam and water enter on the left
flood-plain
near Tomsk in April, 2010 (peak of flooding)
Ice dam
Слайд 741.6. Calculations of the sediment runoff and channel deformation
1.6.1.
Classification of river bed evolution
In accordance with the hydro-morphological theory
of channel process developed by the State Hydrological Institute (SHI), all possible schemes of channel deformation of lowland rivers should be subdivided into seven types (Fig. 1.6.1.1).Слайд 75Fig. 1.6.1.1. Types of river bed evolution and their main
meters: 1 – ribbon ridge type (lг - step of
ribbon ridges); 2 – “pobochnevy” (shoal) type (lпб - by-step); 3 - limited meandering (lи – bend step, a0 – angle of the bend rotation); 4 - free meandering (Sи – length of the bend, lи – bend step, a1 – angle of entry, a2 –angle of exit); 5 – incomplete meandering; 1a – river bed with many arms; 5a – floodplain with many armsСлайд 76Ribbon Ridge type (variant of straight channels) of channel process
occurs in small and average lowland rivers (and the individual
arms) consisted of sand. It occurs rarely. The velocity of ridge moving is determined by the dependence:, (1.6.1.1)
where Cg – velocity of ridges offset (m/s); V - average velocity of (m/s); Fr - Froude number.
Слайд 77“Pobochnevy” (shoal; a variant of straight channels) type of channel
process occurs in the lowland and submountain rivers formed of
sediment of any size. It occurs mainly on the straight and poorly meander sections of the rivers (and the individual arms).Limited meandering (variant of meandering channels) is the type of channel process, mostly distributed in lowland rivers. It is characterized by the rotation angle up to 120°. The free development of the horizontal channel deformation at this type of channel process is limited by the impossibility of washing out of valley slopes.
Слайд 78Free meandering (variant of meandering channels) is the most distributed
type of channel process in lowland rivers. It usually develops
in the broad river valleys, the slopes of which do not restrict the free development of horizontal deformations.Incomplete meandering (variant of meandering channels) is a kind of free meandering. It is characterized by the channel which straightens a meander. It occurs on strong flooded lands in the flood-time.
Слайд 80Floodplain with many arms (variant of braided channels) is the
further development and complication of incomplete meandering. It is characterized
by a broad flood plain. Channel processes on each arm can develop under the laws of any type.“Oseredkovy” (braided) type (a variant of braided channels) of channel process (channel with many arms) is available at the sites of the lowland, mountain and submountain. It is characterized by prostrate channel, on which the channel forms are moving in flood period: “oseredki” (islands without vegetation), shoals and ribbon ridges.
Слайд 811.6.2. Suspended Sediment Runoff
1.6.2.1. Determination in presence of observational data
Determination
of the characteristics of suspended sediment runoff in the presence
of observational data in general is similar to the corresponding calculation of the basic characteristics of water flow.1.6.2.2. Determination in insufficiency or absence of observational data
In case of observational data insufficiency and significant correlation, the charges of suspended sediment can be restored by observation data of water runoff. Restoration of series is similar to the corresponding calculation of water flow.
Слайд 82In absence of data, the total river sediment flow can
be estimated by analyzing the equation of channel deformation, which
has the form (if width of river ≈ const):, (1.6.2.2.1)
where G1 – runoff by the flow of sediment;
G2 – bottom or rising up;
m0 – relative density of soils and sediments;
B - width of the river, m;
x - coordinate of the longitudinal displacement;
z - elevation bottom; t - coordinate time.
Слайд 83In absence of observational data charge of suspended sediment G2
can be calculated by the method of A.V. Karaushev: G2=(u.+ku)∙Se–ku∙Sv, (1.6.2.2.2)
where u
- hydraulic size of sediment, m/s; Sv - soaring turbidity, g/m3; Se - average turbidity at the end of the element x, g/m3; ku – coefficient of equilibrium:, (1.6.2.2.3)
where Г - hydro-mechanical parameter of sediment, calculated for the i-fraction of sediment :
Гi=БiФi, (1.6.2.2.4)
Function Бi and Фi are defined by the Karaushev method depending on the hydraulic size of sediment u, the vertical fluctuations vz, the average flow velocity, and the values of Chezy coefficient СCh.
Слайд 84Turbidity Sv (in g/m3) is calculated by the formula
, (1.6.2.2.5)
,
(1.6.2.2.6)
, (1.6.2.2.7)
where h – average depth of
the watercourse, m; а=SA/St; g – acceleration due to gravity, m2/sec; –coefficient calculated by the formula:, (1.6.2.2.8)
Слайд 85Carrying capacity St (g/m3) is calculated by the formula:
St =ГSv, (1.6.2.2.9)
Average turbidity
Se at the end of the element x is determined
by:where Sb – average turbidity of water in the beginning of part x, g/m3; Q - water flow, m3/sec.
,(1.6.2.2.10)
Слайд 861.6.3. Bed Load Runoff
1.6.3.1. Determination in the presence of observational
data
In the presence of observational data Bed Load Runoff (G1)
is determined by the dependence G1=f(Q) for the average daily water discharges Q. Then the runoff is calculated for a decade, month, year. The method of further calculations is the same as for the runoff of suspended sediment.1.6.3.2. Determination in insufficiency or absence of observational data
In case of insufficiency or absence of observational data, Bed Load Runoff G1 can be calculated by different methods. Further the methods of I.I. Levi, G.I. Shamov, V.N. Goncharov are presented.
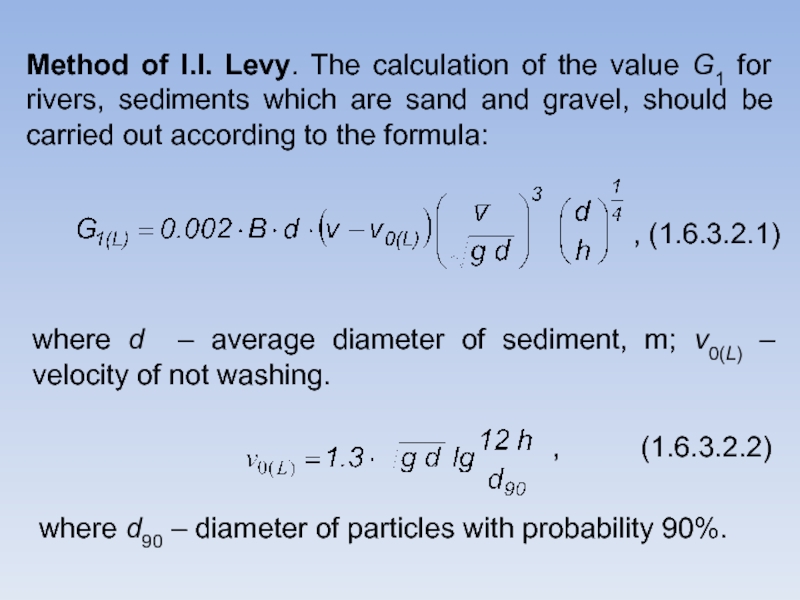
Слайд 87Method of I.I. Levy. The calculation of the value G1
for rivers, sediments which are sand and gravel, should be
carried out according to the formula:, (1.6.3.2.1)
where d – average diameter of sediment, m; v0(L) – velocity of not washing.
where d90 – diameter of particles with probability 90%.
, (1.6.3.2.2)
Слайд 88Method of G.I. Shamov. The calculation of Bed Load discharge
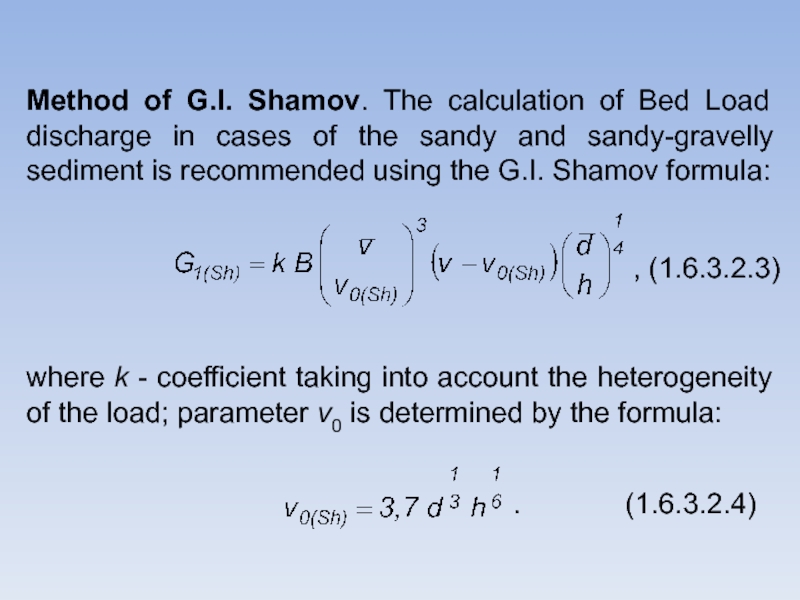
in cases of the sandy and sandy-gravelly sediment is recommended
using the G.I. Shamov formula:, (1.6.3.2.3)
where k - coefficient taking into account the heterogeneity of the load; parameter v0 is determined by the formula:
. (1.6.3.2.4)
Слайд 89Method of V.N. Goncharov. V.N. Goncharov has shown for sediments
with the diameter from 0.2 to 10 mm is advisable
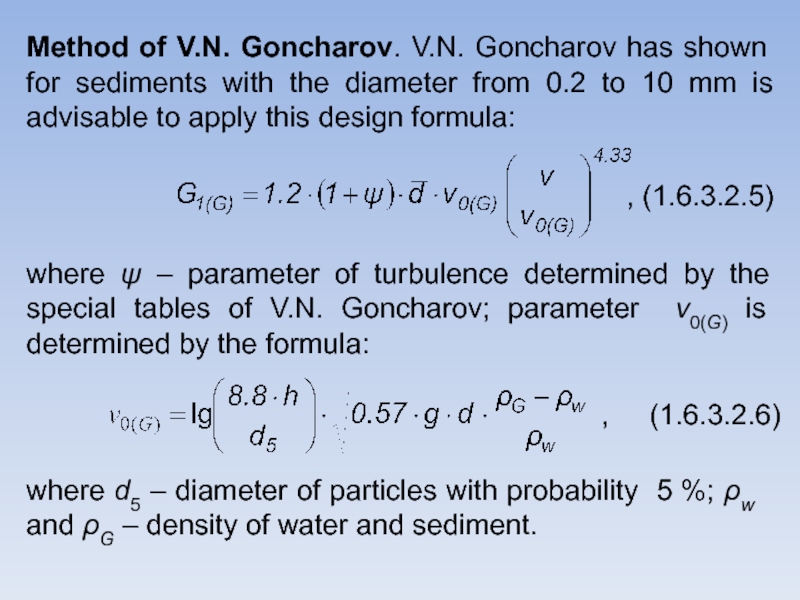
to apply this design formula:, (1.6.3.2.5)
where – parameter of turbulence determined by the special tables of V.N. Goncharov; parameter v0(G) is determined by the formula:
, (1.6.3.2.6)
where d5 – diameter of particles with probability 5 %; w and G – density of water and sediment.
Слайд 911.6.4. Vertical Deformation of Riverbed
1.6.4.1. Determination in the presence
of observational data
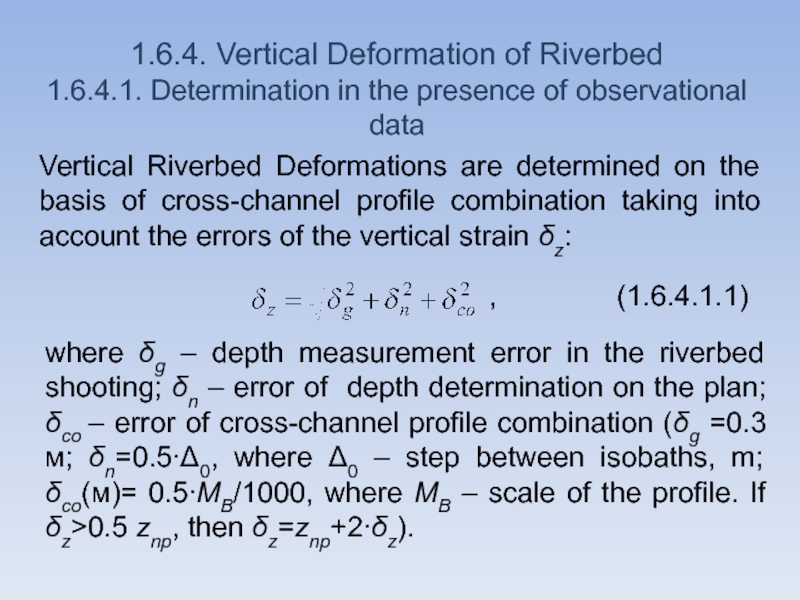
Vertical Riverbed Deformations are determined on the basis
of cross-channel profile combination taking into account the errors of the vertical strain z:, (1.6.4.1.1)
where g – depth measurement error in the riverbed shooting; n – error of depth determination on the plan; сo – error of cross-channel profile combination (g =0.3 м; n=0.5∙0, where 0 – step between isobaths, m; сo(м)= 0.5∙MB/1000, where MB – scale of the profile. If z>0.5 znp, then z=znp+2∙z).
Слайд 921.6.4.2. Determination in insufficiency or absence of observational data
In the
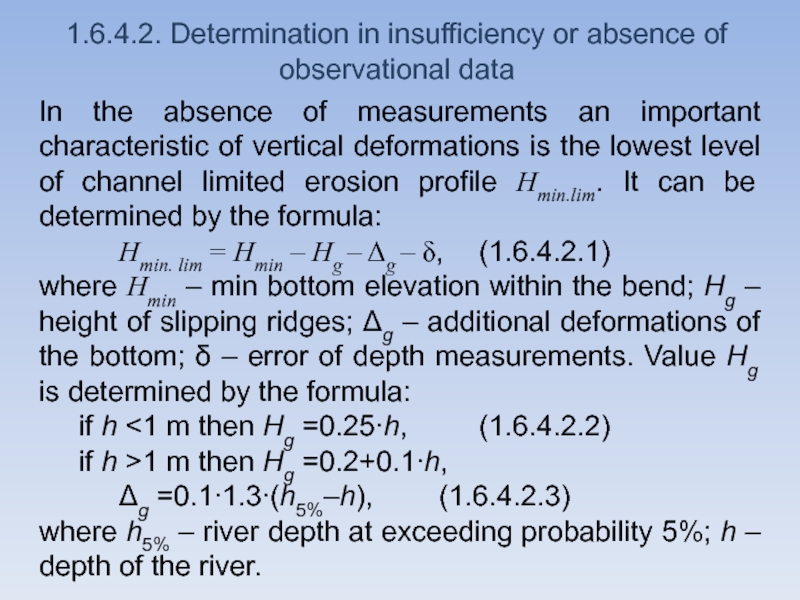
absence of measurements an important characteristic of vertical deformations is
the lowest level of channel limited erosion profile Hmin.lim. It can be determined by the formula:Hmin. lim = Hmin – Hg – g – , (1.6.4.2.1)
where Hmin – min bottom elevation within the bend; Hg – height of slipping ridges; g – additional deformations of the bottom; – error of depth measurements. Value Hg is determined by the formula:
if h <1 m then Hg =0.25∙h, (1.6.4.2.2)
if h >1 m then Hg =0.2+0.1∙h,
g =0.1∙1.3∙(h5%–h), (1.6.4.2.3)
where h5% – river depth at exceeding probability 5%; h – depth of the river.
Слайд 941.6.5. Horizontal Channel Deformation
Planned deformations are determined on the
basis of maps and topographical comparison in view of an
average common error y:, (1.6.5.1)
where M – scale coefficient of combined plans; с – error of channel planned measurement; np – errors of reduction of maps to the one scale; сo – error of map overlapping; ob – measurement error of the coast line displacement on the combined plans. Average errors of the planned survey is usually taken as 0.5 mm in the plan scale.
Слайд 95The average error of map reduction to the common scale
(in millimeters of the reduced scale) should be equal:
,
(1.6.5.2)where nM – the ratio of the biggest scale coefficient to the smallest; 0.5 mm – the average error of the characteristic length. Combined survey should lead to a larger scale. The error of map overlapping сo is taken equal to 1 mm in the plan scale in presence of common and time constant benchmarks in the maps.
Слайд 961.6.6. An example of sediment runoff
An example is a model
of vertical deformations of channel of the Tom' River near
Tomsk city for planning change of a channel.This model is based on the numerical solution of equation (1.6.2.2.1).
The value of the runoff of suspended sediment was calculated by the method of A.V. Karaushev, and the calculation of sediment runoff were performed by the methods of G.I. Shamov, I.I. Levy, K.I. Rossinsky and V.N. Goncharov.
Слайд 97The map of research site of the Tom‘ River; points
from the river mouth (from 74.8 km to 58.3 km)
Слайд 98Changing the total sediment runoff of the Tom’ River on
part 74.8-58.3 km from the mouth; Q=6860 m3/s (average maximum)
Слайд 99Changing the total cost of sediment of the Tom river
on part 74.8-58.3 km from the mouth; Q=472 m3/s (low
water)Слайд 100Change in mean cross-sectional deformation intensity bottom of the Tom’
River on the part 74.8-58.3 km from the mouth; Q=6860
m3/s (average maximum)Слайд 101Change in mean cross-sectional deformation intensity bottom of the Tom’
River on the part 74.8-58.3 km from the mouth; Q=1090
m3/s (annual discharge)Слайд 1022. Features of mathematical modeling of hydrological processes and calculations
in Siberia
Features of mathematical modeling and hydrological computations in Siberia
are defined by the following:Siberia is a part of the Northern Eurasia. Conditions of the flow formation in this huge area are extremely varied.
Hydrological and meteorological studies of Siberia are generally weak. Network of hydrological observation is rare.
The role of swaps in the formation of an average, maximum, and minimum flow is not enough studied .
Methods of swamp water level computation remain at the level of the 1960’s; and it does not meet the demands of practice and theory.
Слайд 105In the permafrost the displacement and change of the water
body boundaries on the territory are possible up to several
tens of meters per a year.One of the results of roads and pipelines construction is superfluous humidity of the territories nearby the engineering objects. Sometimes this effect is incorrectly connected with the global warming.
Actually, the observations of lake water levels in forest, forest tundra and tundra-forest areas are absent.
Actually, the observations of sediments and deformations of river bed are absent.
Roshydromet observations of ice and thermal regime of rivers do not allow us to assess the formation conditions of ice jams and ice dams.
Слайд 10710. There are very serious problems with assessment of hydro-meteorological
information in Russia.
11. The rivers of Siberia are often characterized
by large amplitude of levels and flow variations (10 m and more), ice jams and hanging ice dams, and in some cases by large bank deformation (more 10 m/year). This poses serious problems in construction and operation of some engineering objects in the river valleys. 12. Russia's current methods of the calculations do not focus on new types of information associated with distant methods; and they do not allow estimating changes in hydrological processes under climate change conditions for certain.
