Разделы презентаций
- Разное
- Английский язык
- Астрономия
- Алгебра
- Биология
- География
- Геометрия
- Детские презентации
- Информатика
- История
- Литература
- Математика
- Медицина
- Менеджмент
- Музыка
- МХК
- Немецкий язык
- ОБЖ
- Обществознание
- Окружающий мир
- Педагогика
- Русский язык
- Технология
- Физика
- Философия
- Химия
- Шаблоны, картинки для презентаций
- Экология
- Экономика
- Юриспруденция
Introduction to Pharmacoeconomics
Содержание
- 1. Introduction to Pharmacoeconomics
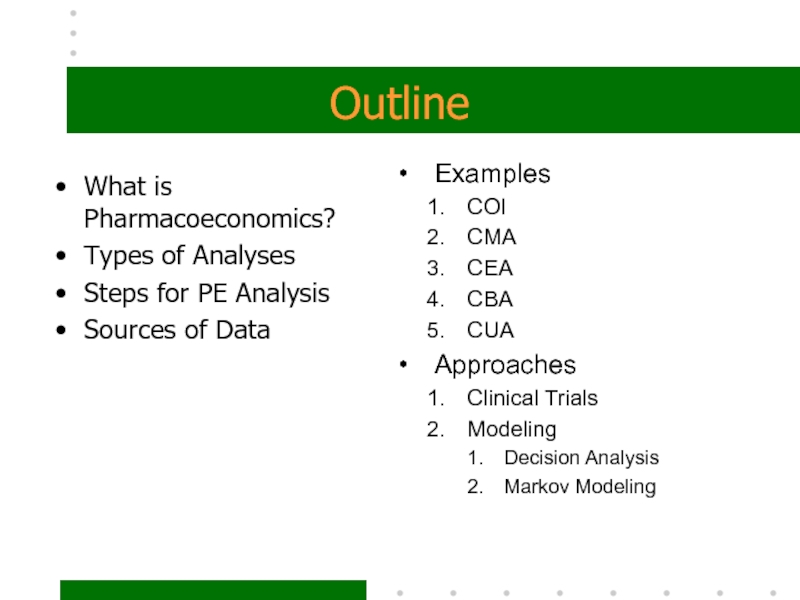
- 2. OutlineWhat is Pharmacoeconomics?Types of AnalysesSteps for PE AnalysisSources of DataExamples COICMACEACBACUAApproachesClinical TrialsModelingDecision AnalysisMarkov Modeling
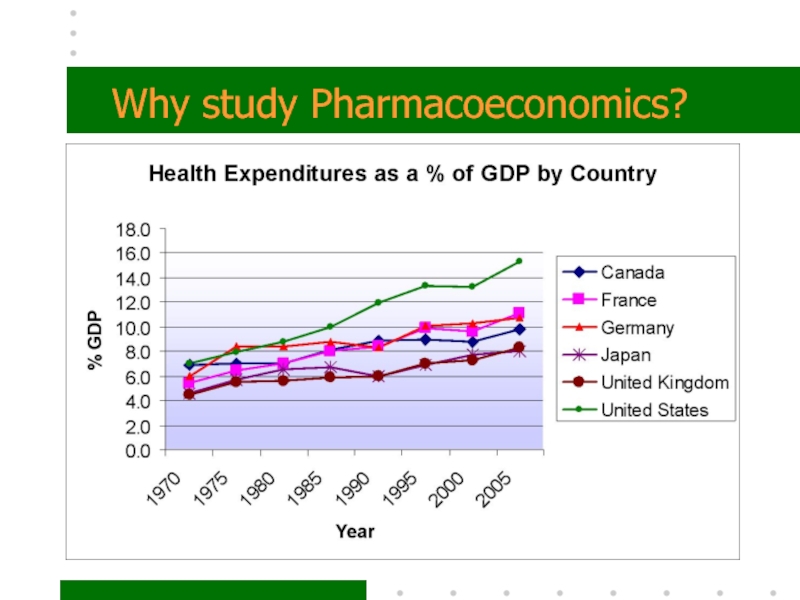
- 3. Why study Pharmacoeconomics?
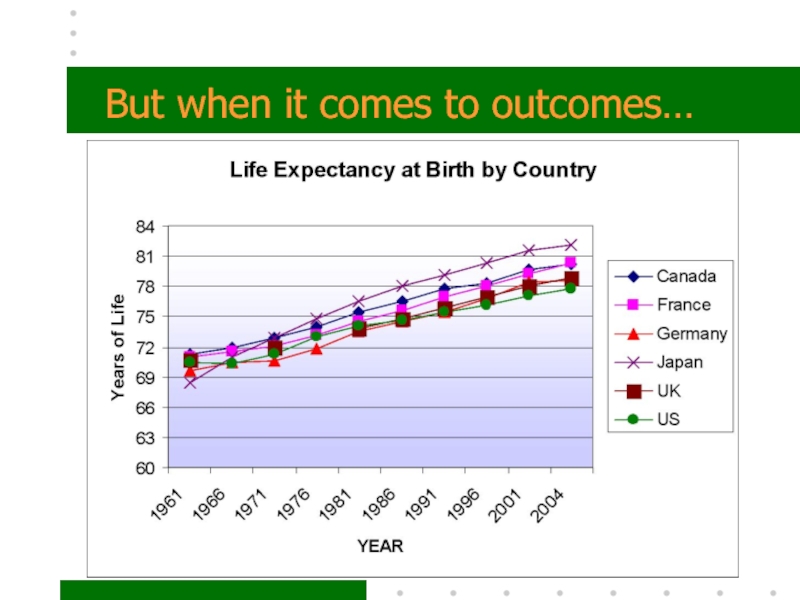
- 4. But when it comes to outcomes…
- 5. So…What are we doing wrong? And how
- 6. Pharmacoeconomics is a set of methods to
- 7. Pharmacoeconomics allows us to compare the economic
- 8. Five types of Pharmacoeconomic AnalysesCost of Illness
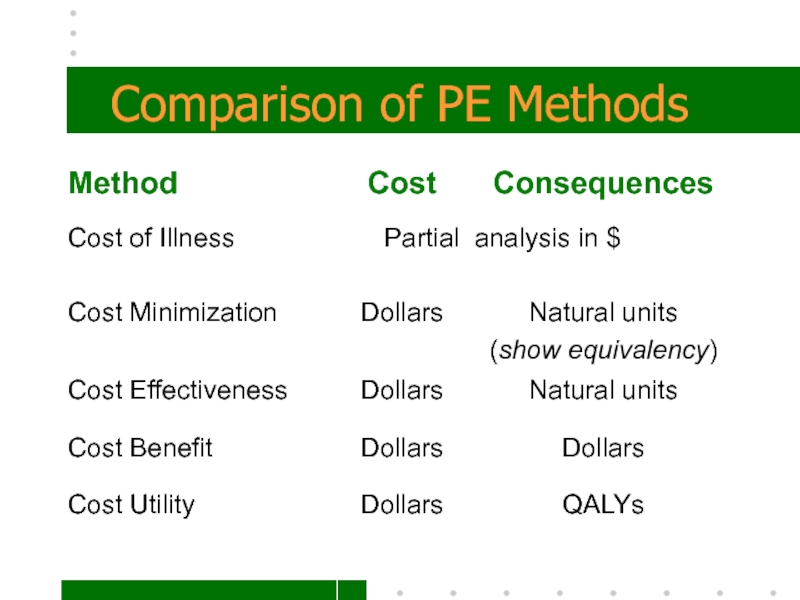
- 9. Comparison of PE Methods
- 10. Steps for conducting a PE Analysis define the
- 11. 1. Define the problem and state the
- 12. 2. Identify the perspective…that is, who will
- 13. PerspectivesPatientHealth PractitionerHospitals or Hospital systemsThird-Party payersSocietal
- 14. Patient PerspectiveExamples of costs that directly affect
- 15. Health PractitionerCosts to physicians may include:HospitalizationPharmacyPersonnelSupplies Consequences of interest are: Therapeutic effectivenessAdverse events
- 16. HospitalsCosts include:Hospital stay costs Treatment of adverse events & complications Consequences of interest:Therapeutic effectivenessAdverse events
- 17. Third-Party PayerCosts of care incurred for covered services which may include:HospitalizationPharmacy Nursing home careConsequences of interestNone
- 18. SocietalAll possible costs including lost productivity All possible consequences including QoL, & life years.
- 19. 3. Identify Alternative InterventionsWhat are the relevant
- 20. Cost and Effectiveness Comparison Grid
- 21. 4. Identify and measure outcomes of
- 22. ECHO ModelE conomicC linicalH umanisticO utcomes
- 23. Types of Outcomesintermediate outcomes such as controlling
- 24. 5. Identify, Measure and Value costsCosts include:direct
- 25. Measuring CostsCosts are measured over a relevant
- 26. Valuing CostsDetermining the amount (dollar value) for
- 27. Sensitivity AnalysisWhen estimating costs and outcomes, you
- 28. DiscountingIf the analysis spans more than a
- 29. Discounting exampleYou wish to implement a diabetes
- 30. Discounting Example
- 31. Sources of dataPublished information – journals, RCTsSecondary
- 32. Five types of Pharmacoeconomic AnalysesCost of Illness (COI)Cost-minimization (CMA)Cost-benefit (CBA)Cost-effectiveness (CEA)Cost-utility (CUA)
- 33. 1. Cost of IllnessEvaluation of overall economic
- 34. Cost of Illness“An illness consumes resources and,
- 35. 2. Cost-MinimizationThis type of evaluation compares two
- 36. 3. Cost-effectivenessIf you can measure the therapeutic
- 37. are those with outcomes worth their corresponding
- 38. Examples where CEA is best techniqueCompare the
- 39. 4. Cost-Benefit AnalysisEvaluation technique for comparing the
- 40. 4. Cost-Benefit AnalysisTwo methods are used for
- 41. Examples of questions CBA may addressAIDS prevention
- 42. 5. Cost-utilityintegrates both costs and consequences within
- 43. Quality Adjusted Life YearsQALY = Utility x
- 44. Application of CUACUA is the most difficult
- 45. Approaches to Obtaining Effectiveness Clinical
- 46. Approaches to Obtaining Effectiveness ModelingSynthesizes data from
- 47. (1) Decision Tree Models
- 48. (2) Markov models
- 49. SummaryResearch questionPerspectiveType of analysisAppropriate Comparators?Relevant costs and consequencesValidated instrumentsTime period, discountingSensitivity analysisGeneralizability
- 50. Скачать презентанцию
OutlineWhat is Pharmacoeconomics?Types of AnalysesSteps for PE AnalysisSources of DataExamples COICMACEACBACUAApproachesClinical TrialsModelingDecision AnalysisMarkov Modeling
Слайды и текст этой презентации
Слайд 1Introduction to Pharmacoeconomics
Ellen Campbell, Ph.D.
Division of Economic, Social & Administrative
Pharmacy
19, 2007Слайд 2Outline
What is Pharmacoeconomics?
Types of Analyses
Steps for PE Analysis
Sources of Data
Examples
COI
CMA
CEA
CBA
CUA
Approaches
Clinical Trials
Modeling
Decision Analysis
Markov Modeling
Слайд 5So…
What are we doing wrong?
And how can we improve
our performance?
by spending less
getting better outcomes
Слайд 6Pharmacoeconomics
is a set of methods to evaluate the
Economic,
Clinical,
and
Humanistic
Outcomes (ECHO) of pharmaceutical products
and services (or any health care service)Слайд 7Pharmacoeconomics allows us
to compare the economic resources consumed (inputs)
to produce the health and economic consequences of products or
services (outcomes).INPUTS OUTCOMES
Economic Health and Economic
Resources Consequences
Слайд 8Five types of Pharmacoeconomic Analyses
Cost of Illness (COI)
Cost-minimization (CMA)
Cost-benefit (CBA)
Cost-effectiveness
(CEA)
Cost-utility (CUA)
these methods differ by how you measure the consequence
or outcomeСлайд 10Steps for conducting a PE Analysis
define the problem
identify the perspective
and alternative interventions to be compared
identify and measure outcomes of
each alternativeidentify, measure and value costs of all alternatives
use discounting and sensitivity analysis when appropriate
Слайд 111. Define the problem and state the objective
Identify the disease
state and what aspect you want to deal with.
i.e. What
is the most cost effective method for controlling glucose in the treatment of type II diabetes?Слайд 122. Identify the perspective…
that is, who will be utilizing the
information to make what decisions.
This will guide you in choosing
the relevant costs and benefits.Слайд 13Perspectives
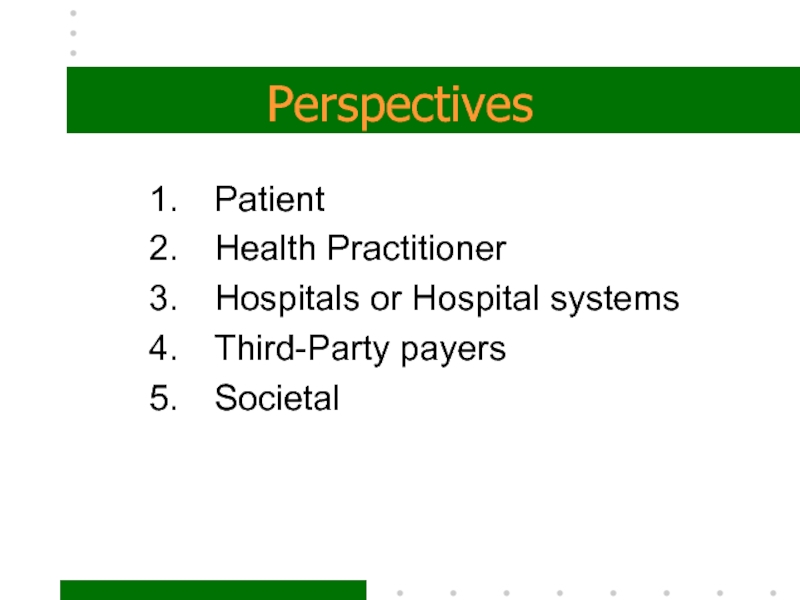
Patient
Health Practitioner
Hospitals or Hospital systems
Third-Party payers
Societal
Слайд 14Patient Perspective
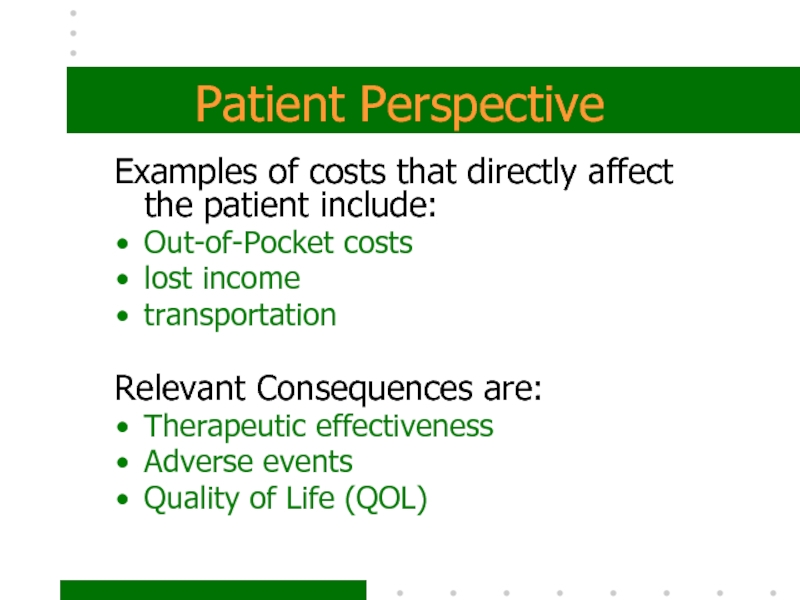
Examples of costs that directly affect the patient include:
Out-of-Pocket
costs
lost income
transportation
Relevant Consequences are:
Therapeutic effectiveness
Adverse events
Quality of Life (QOL)
Слайд 15Health Practitioner
Costs to physicians may include:
Hospitalization
Pharmacy
Personnel
Supplies
Consequences of interest are:
Therapeutic
effectiveness
Adverse events
Слайд 16Hospitals
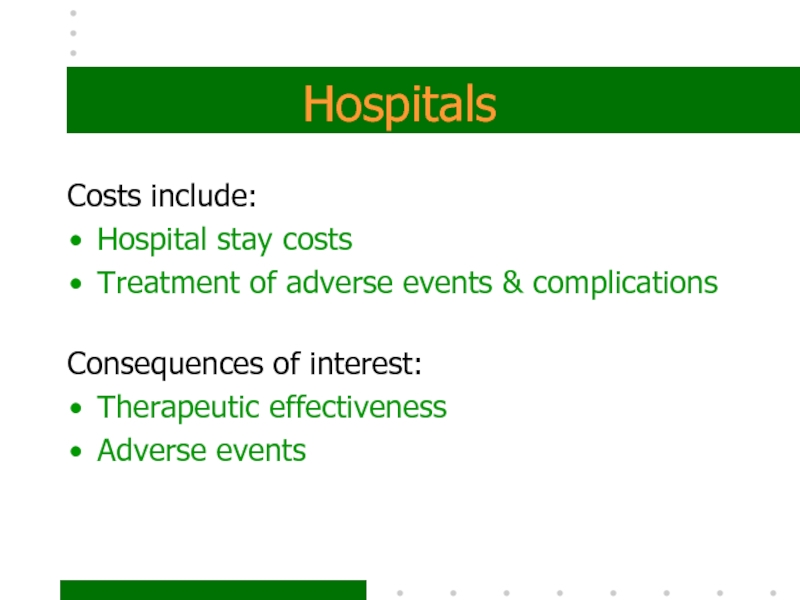
Costs include:
Hospital stay costs
Treatment of adverse events & complications
Consequences
of interest:
Therapeutic effectiveness
Adverse events
Слайд 17Third-Party Payer
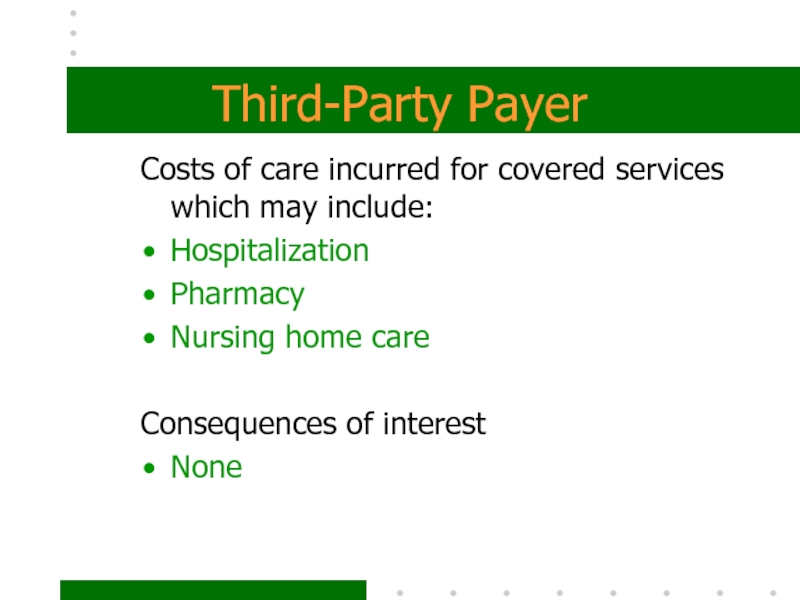
Costs of care incurred for covered services which may
include:
Hospitalization
Pharmacy
Nursing home care
Consequences of interest
None
Слайд 18Societal
All possible costs including lost productivity
All possible consequences including QoL,
& life years.
Слайд 193. Identify Alternative Interventions
What are the relevant choices?
Often a head-to-head
comparison of the most used (traditional) treatment with the new
one.It’s important to compare with the most likely substitute for a realistic result.
The comparator doesn’t have to be a drug therapy.
Слайд 214. Identify and measure
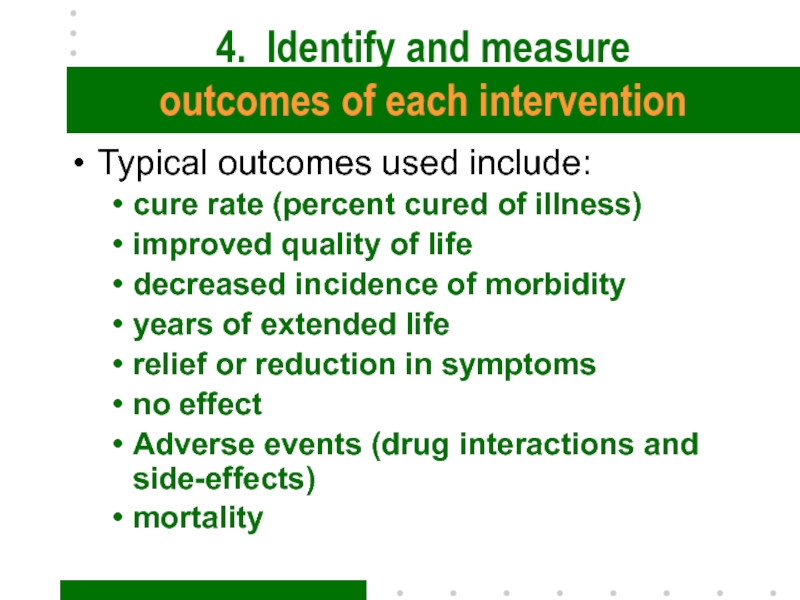
outcomes of each intervention
Typical outcomes used
include:
cure rate (percent cured of illness)
improved quality of life
decreased incidence
of morbidityyears of extended life
relief or reduction in symptoms
no effect
Adverse events (drug interactions and side-effects)
mortality
Слайд 23Types of Outcomes
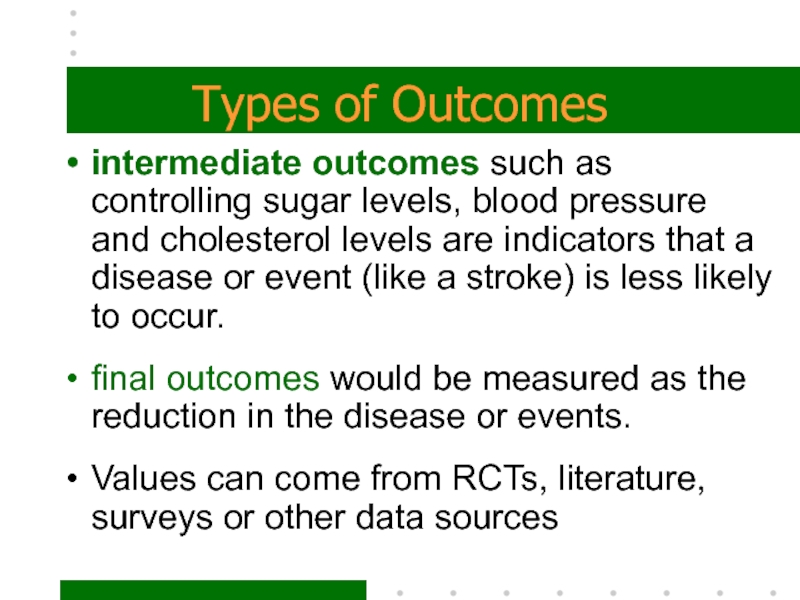
intermediate outcomes such as controlling sugar levels, blood
pressure and cholesterol levels are indicators that a disease or
event (like a stroke) is less likely to occur.final outcomes would be measured as the reduction in the disease or events.
Values can come from RCTs, literature, surveys or other data sources
Слайд 245. Identify, Measure and Value costs
Costs include:
direct medical costs like
office visits, hospitalizations, any treatment costs;
direct non-medical costs like
transportation to get treatment;indirect costs like missed work due to illness;
intangible costs like pain and suffering.
Be sure to include those costs that are relevant to your perspective.
Слайд 25Measuring Costs
Costs are measured over a relevant time period such
as a month or year.
The length of time used
depends on the typical span of the illness.Acute diseases such as the flu would have a short span; while chronic or long-term illness such as depression or heart disease would span years.
Слайд 26Valuing Costs
Determining the amount (dollar value) for each item (cost/benefit)
listed can be difficult, especially for indirect and intangible costs.
The key is to determine the “opportunity cost” of the resource used. That would be the highest valued alternative use of the resource. Typically use market value.
Sources of cost data include claims data, published price lists..depends on your perspective.
Слайд 27Sensitivity Analysis
When estimating costs and outcomes, you typically have a
range of possible values.
Sensitivity analysis requires that the results
be recalculated at the different values to see if the conclusions change. Слайд 28Discounting
If the analysis spans more than a year, then the
dollar values must be adjusted to a common point in
time.Discounting adjusts future costs or benefits using an expected interest or discount rate.
Present Value = Future value
(1+r)n
where r = discount rate (typically ranges from .03 to .06)
and n = the number of years in the future.
Слайд 29Discounting example
You wish to implement a diabetes DSM program which
will cost you $1500 per year.
The benefits from this
program won’t be evident for 2 years, so you want to evaluate it after 4 years. Use r = .05
Слайд 31Sources of data
Published information – journals, RCTs
Secondary data – single
firm (internal), company level, state or national data (external)
Primary data
collection – sample selection, validated instrumentsEach choice affects the generalizability of your results
Слайд 32Five types of Pharmacoeconomic Analyses
Cost of Illness (COI)
Cost-minimization (CMA)
Cost-benefit (CBA)
Cost-effectiveness
(CEA)
Cost-utility (CUA)
Слайд 331. Cost of Illness
Evaluation of overall economic impact of a
disease on a population
Measures the economic burden of a disease
Sum
of all costs and all consequences of the diseaseHas the advantage of defining the disease, its epidemiology, outcomes and consequences.
Example – Costs attributable to Type II diabetes in adults
Слайд 34Cost of Illness
“An illness consumes resources and, thus, it has
a cost. The cost of an illness is the sum
of three broad components:medical resources used to treat the illness,
the nonmedical resources associated with it, and
lost productivity due to illness or disability” (Larson, 1996)
Слайд 352. Cost-Minimization
This type of evaluation compares two or more alternative
treatments that produce clinically equivalent outcomes.
Once equivalency is demonstrated,
the focus is on choosing the one with the smallest total costs.Example – treating patient w/same therapy in hospital vs home.
Слайд 363. Cost-effectiveness
If you can measure the therapeutic effect in “natural
units” (I.e. weight gained, blood cholesterol level reduction) you compare
the Cost per gain in therapeutic effect.Cost-Effectiveness Ratio =
Cost of treatment ($)
Therapeutic effect* (Natural units)
Limitation – must choose a single measure!
Слайд 37are those with outcomes worth their corresponding costs relative to
competing alternatives
Therapies that are less expensive and at least as
effective as other alternativesTherapies that are more expensive than alternative therapies with an additional benefit worth the additional cost
Therapies that are less expensive and less effective in instances where the extra benefits provided by the competing therapy in not worth the additional expense
Cost-effective therapies
Слайд 38Examples where CEA is best technique
Compare the costs and outcomes
of two or more antihypertensives
Cost per decrease in blood pressure
Compare
two programs designed to prevent excess mortalityCost per life saved
Note: Cost-utility analysis is a special form of cost-effectiveness analysis
Слайд 394. Cost-Benefit Analysis
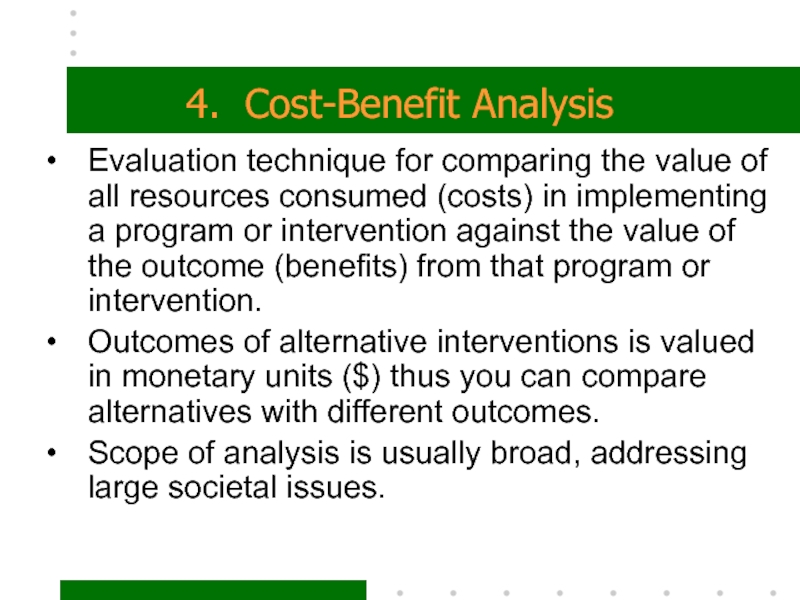
Evaluation technique for comparing the value of all
resources consumed (costs) in implementing a program or intervention against
the value of the outcome (benefits) from that program or intervention.Outcomes of alternative interventions is valued in monetary units ($) thus you can compare alternatives with different outcomes.
Scope of analysis is usually broad, addressing large societal issues.
Слайд 404. Cost-Benefit Analysis
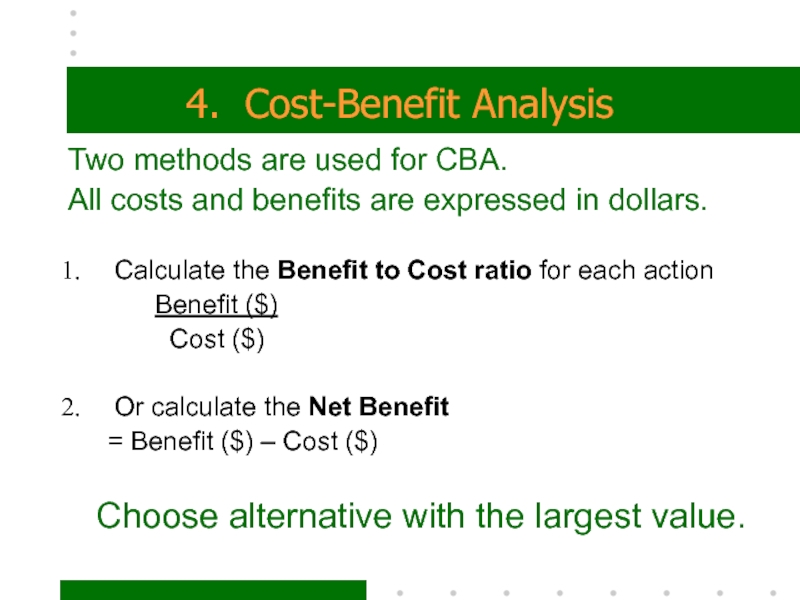
Two methods are used for CBA.
All costs
and benefits are expressed in dollars.
There are two ways
to express the results:Calculate the Benefit to Cost ratio for each action
Benefit ($)
Cost ($)
Or calculate the Net Benefit
= Benefit ($) – Cost ($)
Choose alternative with the largest value.
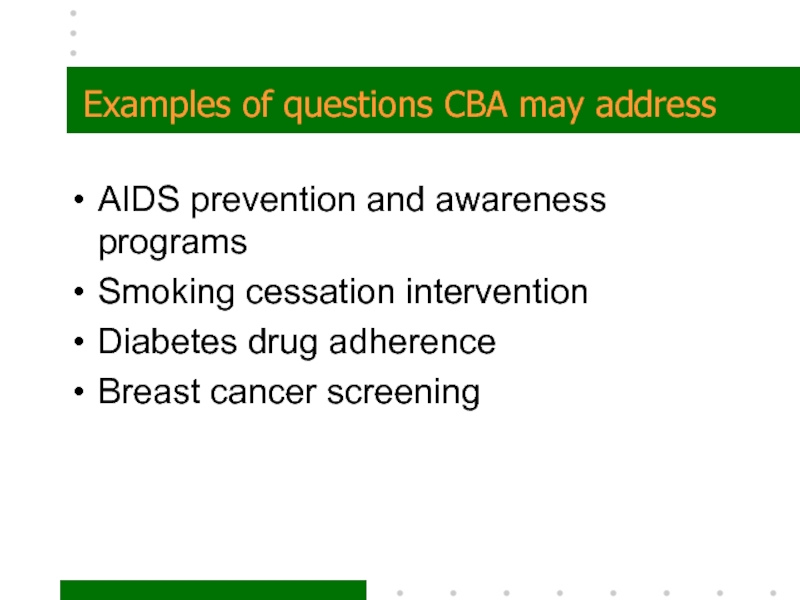
Слайд 41Examples of questions CBA may address
AIDS prevention and awareness programs
Smoking
cessation intervention
Diabetes drug adherence
Breast cancer screening
Слайд 425. Cost-utility
integrates both costs and consequences within the utility analysis
framework.
A variation of CEA
differences between CUA & CEA
CUA requires the
measurement of final outcomes in terms of changes in life expectancy adjusted for patient preferencesIntermediate outcomes are not appropriate to use in cost-utility analysis
outcomes expressed in QALY gained
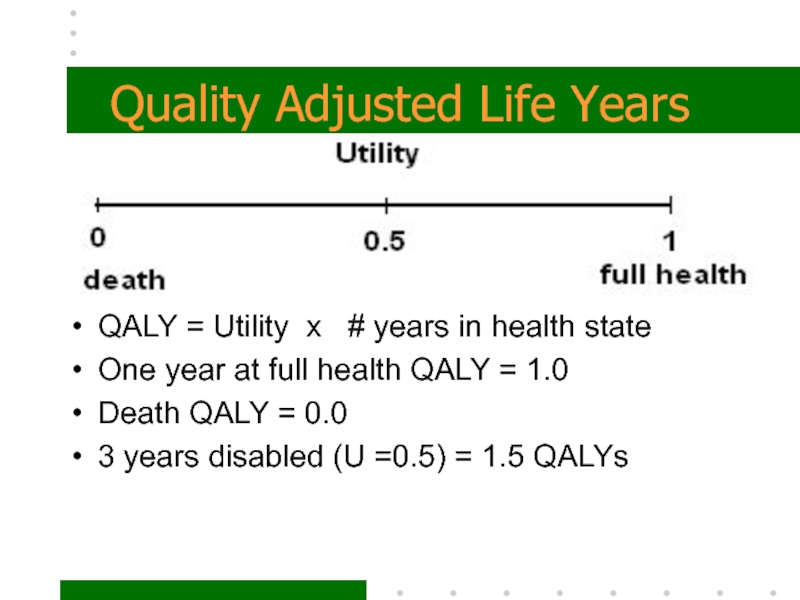
Слайд 43Quality Adjusted Life Years
QALY = Utility x # years
in health state
One year at full health QALY = 1.0
Death
QALY = 0.03 years disabled (U =0.5) = 1.5 QALYs
Слайд 44Application of CUA
CUA is the most difficult and expensive economic
evaluation method to use
CUA should be used when QoL is
the important outcome:Psychological well-being, physical and social function are important in the treatment of arthritis
Chemotherapy may increase survival but decrease well-being, both quality and quantity of life are important
Слайд 45Approaches to Obtaining Effectiveness
Clinical Trials
Randomized Controlled Trials (RCTs) are
typically performed by the drug company to establish safety and
efficacy. Results from RCTs are not always applicable to the real world due to issues such as patient heterogeneity and compliance.Naturalistic design is more real world than RCT, but more expensive to implement.
Слайд 46Approaches to Obtaining Effectiveness
Modeling
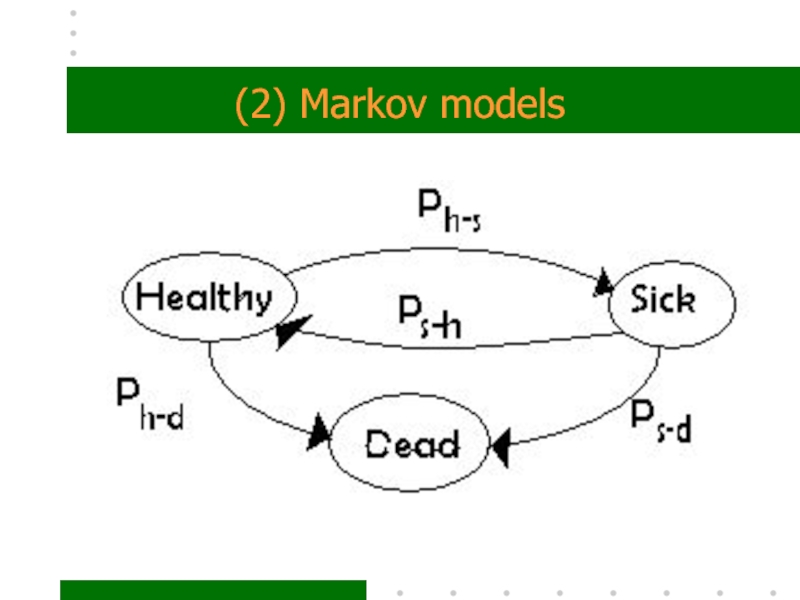
Synthesizes data from the literature to model
the disease, treatment and outcome process.
There are two types
of models:Decision Tree
Markov

