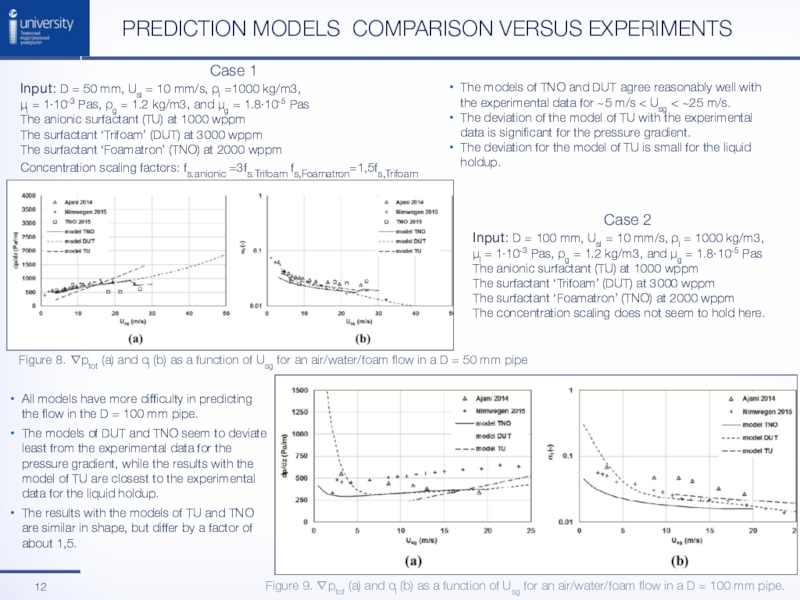
mm/s, l =1000 kg/m3,
l = 1∙10-3 Pas, g =
1.2 kg/m3, and g = 1.8∙10-5 Pas
The anionic surfactant (TU) at 1000 wppm
The surfactant ‘Trifoam’ (DUT) at 3000 wppm
The surfactant ‘Foamatron’ (TNO) at 2000 wppm
Concentration scaling factors: fs.anionic =3fs.Trifoam fs,Foamatron=1,5fs,Trifoam
Case 2
Input: D = 100 mm, Usl = 10 mm/s, l = 1000 kg/m3,
l = 1∙10-3 Pas, g = 1.2 kg/m3, and g = 1.8∙10-5 Pas
The anionic surfactant (TU) at 1000 wppm
The surfactant ‘Trifoam’ (DUT) at 3000 wppm
The surfactant ‘Foamatron’ (TNO) at 2000 wppm
The concentration scaling does not seem to hold here.
Prediction Models COMPARISON versus experiments
Figure 9. ptot (a) and αl (b) as a function of Usg for an air/water/foam flow in a D = 100 mm pipe.
The models of TNO and DUT agree reasonably well with the experimental data for ~5 m/s < Usg < ~25 m/s.
The deviation of the model of TU with the experimental data is significant for the pressure gradient.
The deviation for the model of TU is small for the liquid holdup.
All models have more difficulty in predicting the flow in the D = 100 mm pipe.
The models of DUT and TNO seem to deviate least from the experimental data for the pressure gradient, while the results with the model of TU are closest to the experimental data for the liquid holdup.
The results with the models of TU and TNO are similar in shape, but differ by a factor of about 1,5.
Figure 8. ptot (a) and αl (b) as a function of Usg for an air/water/foam flow in a D = 50 mm pipe


![Ogai Vladislav
Scientific adviser :
Yushkov Anton, PhD
Industrial University of Prediction Models by tno, dut & TU.USED CLOSURE RELATIONS [12]By TNOFilm Prediction Models by tno, dut & TU.USED CLOSURE RELATIONS [12]By TNOFilm liquid content: withFilm viscosity: Interfacial friction:withΓf](/img/tmb/7/634270/7166b25820b4bf06bc0708abcac4be74-800x.jpg)
