Слайд 1Using existing data
Secondary data analysis
Слайд 2What is secondary analysis?
Primary data is data we collect ourselves
and
Secondary data is that collected by others
Secondary analysis is
done on secondary data
In other words, someone else gathered the data – for their own purposes – and then we analyse it for our own purposes.
Слайд 3General observations
A large proportion of research is based on secondary
data
The issues encountered in using secondary data are similar to
data issues in other context
There is a need for a research community for the sharing of secondary data;
Making data available in the public domain
Data evaluation and quality check
New information from the same data, because of new analytical tools, new theoretical perspectives, and new operationalization
The possibility of further use (reanalysis of data)
Слайд 4Issues related to the use of secondary data
An observation
issues are
similar to data issues in other types of empirical research
Assessment
of data quality
The purpose, information of the data
The population of study, sampling framework and procedures
Methods of data collection, response rate
Data coding and entry
Codebook – questionnaire, coding scheme, etc.
Previous research using the data
Слайд 5Advantages of secondary analysis
Saves money and time
Offers high quality data
Gives
an opportunity for longitudinal analysis
Allows subgroup or subset analysis
Gives an
opportunity for cross-cultural studies
Allows more time for data analysis
Enables the application of recent theory to old data
Gets more value from the original data
Слайд 6…but there is a down-side…
You need to become familiar with
how the data was collected, coded and managed
The data can
be very large and complex
The quality of the data should never be taken for granted
Variables important to your analysis might be missing
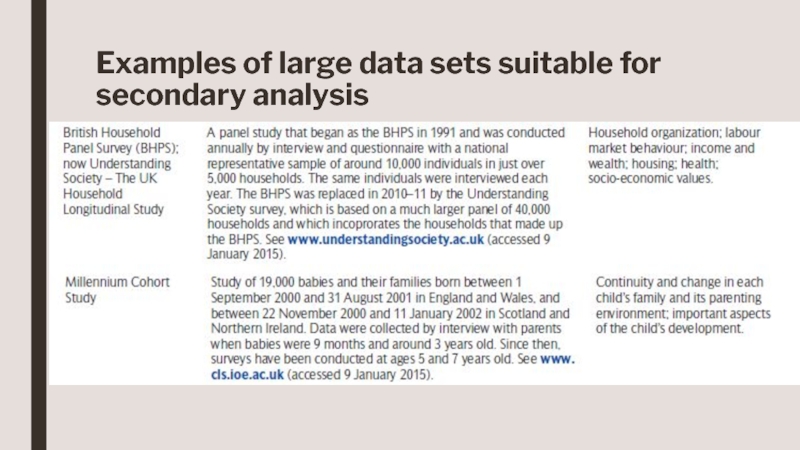
Слайд 8Examples of large data sets suitable for secondary analysis
Слайд 9The UK Data Archive
stores quantitative data from previous studies
housed at
the University of Essex
online catalogue available at:
http://www.dataservice.ac.uk
documentation for
each study
topic, method, sample, sponsors, publications
download and order datasets
Слайд 10The Joint Economic and Social Data Archive
stores quantitative data from
surveys and statistical trends
housed at the Higher School of Economics
online
catalogue available at:
http://sophist.hse.ru/eng/
documentation for each study
topic, method, sample, sponsors, publications
datasets available for free
Слайд 11Official statistics
Collected by agencies of the state, in the course
of their business
e.g. the Employment Service compiles data for the
level of unemployment
Advantages over quantitative data from surveys
reduced time and cost
no problem of reactivity
cross-sectional and longitudinal analysis
cross-cultural analysis
Слайд 12Disadvantages of official statistics
Only reveal ‘tip of the iceberg’
the ‘dark
figure’ of unrecorded events
unemployed people who do not claim benefits
are not officially listed as unemployed
The process used for data collection needs interpretation
dubious measurement validity
Слайд 13Problems with the reliability and validity
of official statistics
Reliability
definitions,
categories and allocated resources change over time
reflects priorities of agencies/organizations
e.g.
changing definitions of crime
Validity
variation may be caused by factors not studied by official reports
the ecological fallacy
Слайд 14What is ‘the ecological fallacy’?
It is the error of assuming
that inferences about individuals can be made from findings relating
to aggregate data.
For example, official statistics might demonstrate a higher incidence of crime in regions with high concentrations of ethnic minorities but the members of the minority groups might not be responsible for the high level of crime.
Слайд 15Condemning official statistics
The widespread criticism of official statistics and their
uses has led to their being largely ignored by social
researchers.
In any event, they are not tailored to the needs of social researchers.
Слайд 16Resurrecting official statistics
Some official statistics – like population census data
– are accurate by any set of criteria
To reject them
because they contain errors is silly, since all measurement in social research is error-prone
The data is gathered ‘unobtrusively’, which means it is free from ‘reactive’ effects.
Слайд 17What are unobtrusive methods?
Webb et al. (1966) distinguish four main
types:
Physical Traces
Archive materials
Simple observation
Contrived observation
Слайд 18Big data
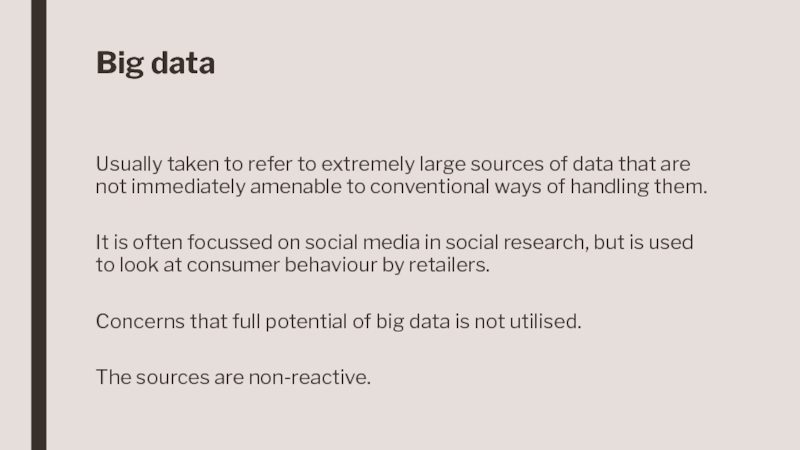
Usually taken to refer to extremely large sources of
data that are not immediately amenable to conventional ways of
handling them.
It is often focussed on social media in social research, but is used to look at consumer behaviour by retailers.
Concerns that full potential of big data is not utilised.
The sources are non-reactive.
