Слайд 1CHAPTER IV
GROWTH AND ACCUMULATION
Слайд 2Economic Condition: Developed and less developed countries
The Western has far
more higher incomes than their great grandfathers
People in developed countries
are far wealthier than people in the less developed countries
Graph -1 shows GDP for four countries over more than 150 years
Слайд 3 Figure 3-1: GDP Growth of USA, Japan, Norway
and Bangladesh
GDP
USA
Japan
Norway
Bangladesh
1860 2009 (Year)
Figure 3-1: GDP Growth of USA, Japan, Norway and Bangladesh
GDP USA
Japan
Norway
Bangladesh
1860 2009 (Year)
Слайд 4The Graph above has four characteristics:
It shows that in in
USA income increased more than sixteen fold over this period
Japan
was poor country before 2nd World War. Now it has a standard of living roughly equal to USA
Norwegian income has increased during the last 30 years
Bangladesh was poor 150 years ago, grew very slowly and remains the same even today
Слайд 5Question is:
What are causes behind these differences?
What will determine
the standard of living in future?
The answer of these
questions are given by:
(i) Growth accounting and
(ii) Theory of Growth
Growth Accounting
Growth accounting explains the role of different factors of production (capital, labour, technology, etc.) in growth
Growth Theory
Growth theory explains how economic progress could be fostered
Слайд 61. GROWTH ACCOUNTING
Growth accounting explains the role of different
Factors
of production in growth
It explains Output (GDP) increases if production
factors:
(i) Capital (K) and Labour Force (N) increase
(ii) And productivity could be enhanced through:
(a) Improved technology
(b) More and skilled work force
The condition of growth can be expressed in following functional relationship between input and output:
Y = A(K, N) (1)
It means: Output depends on the volume of Capital, Labour and Technological Efficiency (A)
Equation (1) is the functional equation of GDP
Equation (1) is also called production function
Слайд 7In Equation (1):
K = Capital (K) and
N = Labour Force
A = Level of Technology (It determines the efficiency of
Labour and Capital)
Equation (I) shows that output (Y) is a function of:
(i) Inputs (K and N) and
(ii) Level of technology (A)
Inputs
More input means more output
Increase in labour force (one input) increases output (marginal product of labour/MPN)
Increase in capital increases output (marginal product of capital/MPK)
Слайд 8Level of technology
The letter “A” in the production function (1)
indicates level of ‘productivity’
Higher level of A means more
output
It means more output is produced for certain inputs
Let us assume that two countries X and Y have same amount of Capital and Labour
Let us assume that the country X is more productive than Y country
So, the country X will produce more output than the country Y
Слайд 92. COMPUTING GROWTH OF OUTPUT
Production function (1) can be used
to explain causes behind the growth of output
It means, it
can be used to deduce a new equation which explains the factors of growth
The new equation is called growth accounting equation
Our Production Function is: Y = A(K, N)
From this equation the following Growth Accounting can be deduced:
Y/Y = [(1 - ) N/N] + ( K/K) + A/A (2)
Equation (2) says that growth of GDP depends on:
Growth of Labour and Share of Labour to GDP
Growth of Capital and Share of Capital to GDP
Слайд 10 (Dividing both side by Y)
Following are steps to deduce
Growth Accounting Equation (2) from Production Equation (1)
[MPK: Marginal Production
of Capital]
[MPL: Marginal Production of Labour]
Слайд 11In Equation (2):
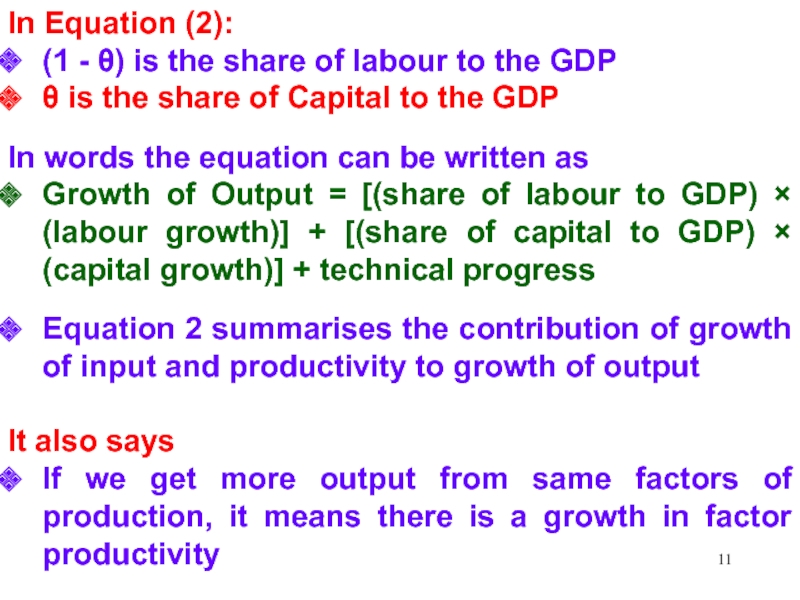
(1 - ) is the share of labour
to the GDP
is the share of Capital to
the GDP
In words the equation can be written as
Growth of Output = [(share of labour to GDP) (labour growth)] + [(share of capital to GDP) (capital growth)] + technical progress
Equation 2 summarises the contribution of growth of input and productivity to growth of output
It also says
If we get more output from same factors of production, it means there is a growth in factor productivity
Слайд 12Example
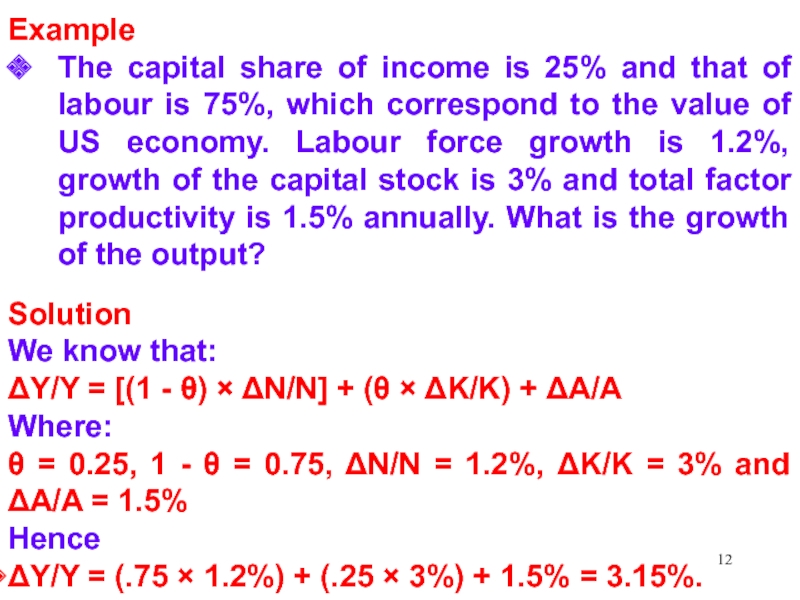
The capital share of income is 25% and that of
labour is 75%, which correspond to the value of US
economy. Labour force growth is 1.2%, growth of the capital stock is 3% and total factor productivity is 1.5% annually. What is the growth of the output?
Solution
We know that:
Y/Y = [(1 - ) N/N] + ( K/K) + A/A
Where:
= 0.25, 1 - = 0.75, N/N = 1.2%, K/K = 3% and A/A = 1.5%
Hence
Y/Y = (.75 1.2%) + (.25 3%) + 1.5% = 3.15%.
Слайд 133. ACCOUNTING GROWTH OF PER CAPITA OUTPUT
It means to find
out on what factors does per capita growth of the
GDP depend
Equation (2) helps explain growth of the GDP
However, it does not say anything about the change in the per capita output
Per Capita Output expresses the living standard
As for instance, Norway is a rich country and India is a poor country
Though, India has larger GDP than Norway
We are interested in the:
Growth of the Per capita GDP
Per capita GDP refers to individual well-being
Per capita GDP is the ratio of GDP to population
Слайд 14Equation (2) says:
Y/Y = [(1 - ) N/N] +
( K/K) + A/A
Hence:
Y/Y = [N/N - N/N] +
(K/K) + A/A
Y/Y = N/N - N/N + (K/K) + A/A
Y/Y - N/N= K/K - N/N + + A/A
Y/Y- N/N = [K/K - N/N] + A/A
y/y = k/k + A/A
y = k/k + A/A
y = (k) + A/A (3)
Where:
Y/Y - N/N = y/y = per capita out put growth, and
[Growth rate of per capita GDP equals the growth rate of GDP minus growth rate of population]
K/K - N/N = k/k = k = per capita capital growth
[Growth rate of capital equals growth rate of per capita capital minus growth rate of the population]
Слайд 15Equation (3) says per capita growth rate of GDP depends
on:
Per capita capital growth (k/k ) and
Change in technological
development (A/A)
And share of capital to the GDP
Example
The value is around 0.25 in USA
It means that:
For 1% increase in the per capita output (GDP) 4% capital has to be employed
We know that:
y = (k) + A/A
Hence
1% = 0.25×k + 0 [In Short term A/A = 0]
1% = 0.25×4%
[It means 1% per capita growth of GDP needs 4% growth of per capita capital]
Слайд 164. Accounting Technological Change
Let us the growth of GDP,
Population Growth and Capital Growth are known, so:
Hence:
(3)
(4)
Слайд 17Technological progress cause increase of labour productivity
Such progress is called
labour stimulating technological progress
For labour stimulating technological progress the equation
(4) can be written as:
Hence:
(5)
Слайд 185. Cobb-Douglas Production Function
Here:
is share of capital to
the GDP [For USA = 0.80]
1- is the share
of the labour to the GDP
K is Capital and N Population
Cobb-Douglas Production Function could be transferred into per capita form and used for growth accounting:
[k is per capita growth of capital, A is the change in productivity]
In functional form this equation could be written as:
y = (k)
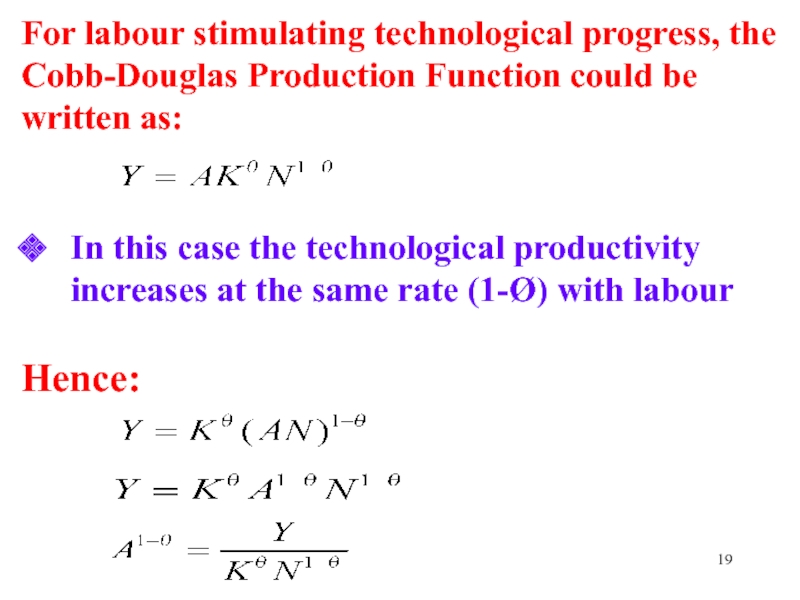
Слайд 19For labour stimulating technological progress, the Cobb-Douglas Production Function could
be written as:
In this case the technological productivity increases at
the same rate (1-Ø) with labour
Hence:
Слайд 206. Empirical Estimate of Growth
Capital Growth
Robert Solow studied period 1909-1949
in USA and concluded that over 80% of the growth
was due to technical progress
Important determinants of per GDP growth are (i) Technical Progress and (ii) Capital Accumulation
Population Growth
More workers means more output, but output increases proportionately slowly
1% growth of labour force leads to about 0.80% growth in output
As output grows slowly than numbers of workers, per capita output falls
Слайд 217. Growth Factors Other Than Capital and Labour
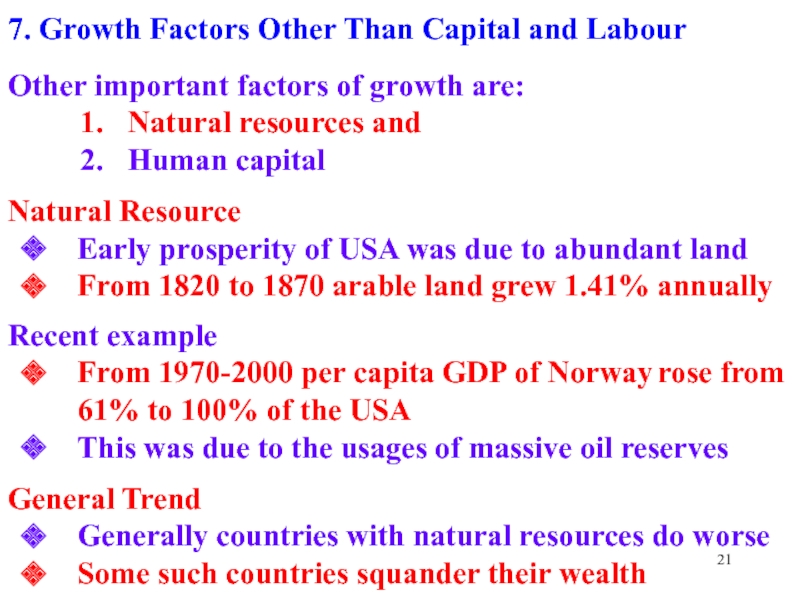
Other important factors
of growth are:
Natural resources and
Human capital
Natural Resource
Early prosperity of
USA was due to abundant land
From 1820 to 1870 arable land grew 1.41% annually
Recent example
From 1970-2000 per capita GDP of Norway rose from 61% to 100% of the USA
This was due to the usages of massive oil reserves
General Trend
Generally countries with natural resources do worse
Some such countries squander their wealth
Слайд 22Human Capital
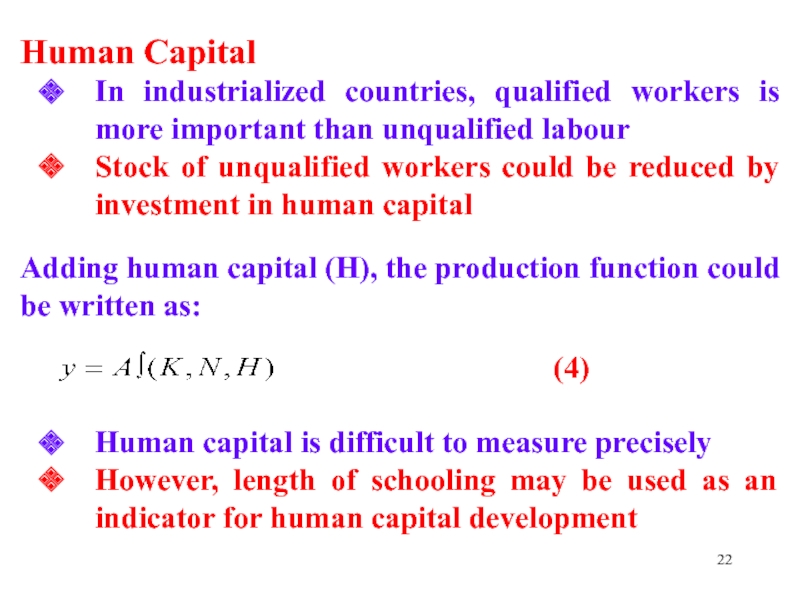
In industrialized countries, qualified workers is more important than
unqualified labour
Stock of unqualified workers could be reduced by investment
in human capital
Adding human capital (H), the production function could be written as:
(4)
Human capital is difficult to measure precisely
However, length of schooling may be used as an indicator for human capital development
Слайд 23Impact of Immigration on Human Capital
Immigration boosts per capital output
when skilled workers enter in the migrating country
From immigration USA
has benefited so far
In USA always the qualified workers immigrated
Impact of Refugees on Human Capital
Immigration of refugees decreases per capita output in the short run
A factor of production increases the growth only when the supply of this factor grows
Слайд 24Problem # 1
In a simple scenario with only two factors
of production, suppose that capital’s share of income is .4
and labor's share is .6 and that annual growth rates of capital and labor are 6 and 2 percent, respectively. Assume there is no technical change.
a. At what rate does output grow?
b. How long will it take for output to double?
c. Now suppose technology grows at a rate of 2
percent. Recalculate your answers to (a) and
(b).
Слайд 25Problem # 2
Suppose output is growing at 3 percent per
year
and capital's and labor's shares of income are 0.3
and 0.7, respectively.
If both labor and capital grow at 1 percent per year, what would the growth rate of total factor productivity have to be?
What if both the labor and the capital stocks
are fixed?
Слайд 26Problem # 3
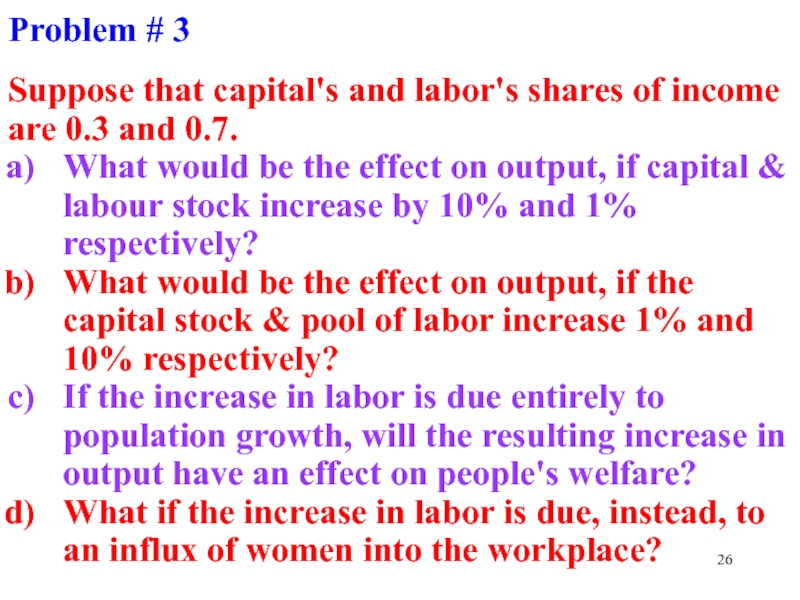
Suppose that capital's and labor's shares of income
are 0.3 and 0.7.
What would be the effect on output,
if capital & labour stock increase by 10% and 1% respectively?
What would be the effect on output, if the capital stock & pool of labor increase 1% and 10% respectively?
If the increase in labor is due entirely to population growth, will the resulting increase in output have an effect on people's welfare?
What if the increase in labor is due, instead, to an influx of women into the workplace?
Слайд 27Problem
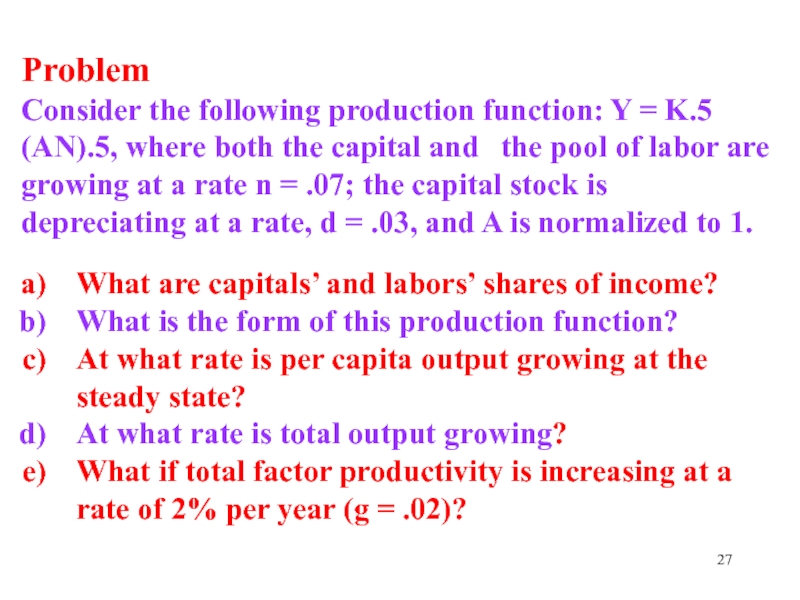
Consider the following production function: Y = K.5 (AN).5, where
both the capital and the pool of labor are growing
at a rate n = .07; the capital stock is depreciating at a rate, d = .03, and A is normalized to 1.
What are capitals’ and labors’ shares of income?
What is the form of this production function?
At what rate is per capita output growing at the steady state?
At what rate is total output growing?
What if total factor productivity is increasing at a rate of 2% per year (g = .02)?
Слайд 28Questions
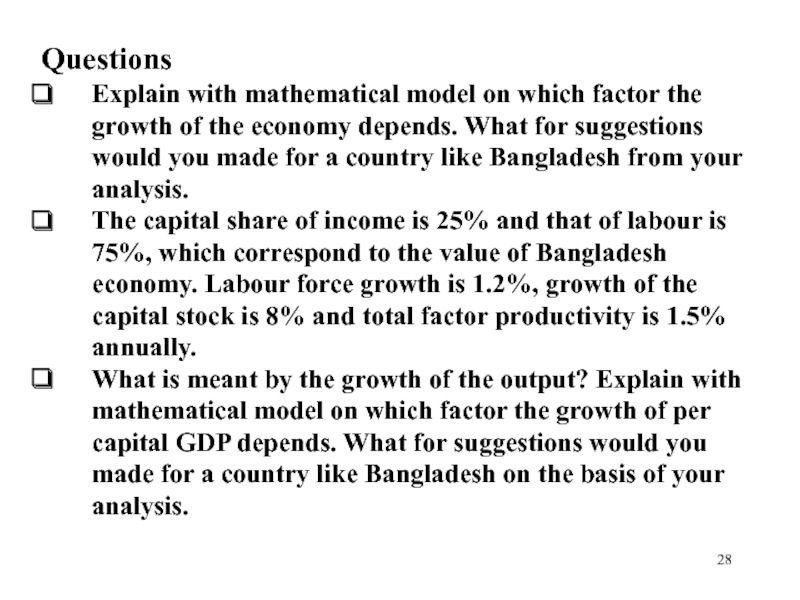
Explain with mathematical model on which factor the growth
of the economy depends. What for suggestions would you made
for a country like Bangladesh from your analysis.
The capital share of income is 25% and that of labour is 75%, which correspond to the value of Bangladesh economy. Labour force growth is 1.2%, growth of the capital stock is 8% and total factor productivity is 1.5% annually.
What is meant by the growth of the output? Explain with mathematical model on which factor the growth of per capital GDP depends. What for suggestions would you made for a country like Bangladesh on the basis of your analysis.
Слайд 29Questions
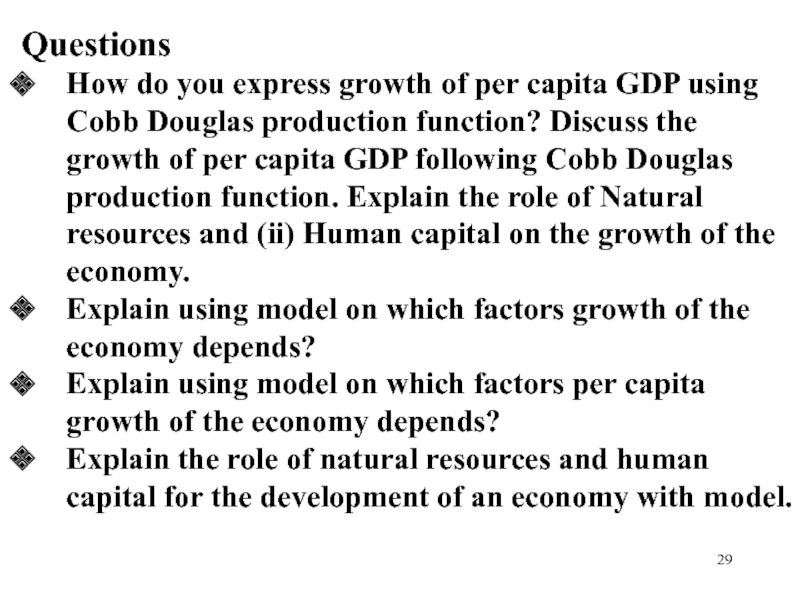
How do you express growth of per capita GDP using
Cobb Douglas production function? Discuss the growth of per capita
GDP following Cobb Douglas production function. Explain the role of Natural resources and (ii) Human capital on the growth of the economy.
Explain using model on which factors growth of the economy depends?
Explain using model on which factors per capita growth of the economy depends?
Explain the role of natural resources and human capital for the development of an economy with model.
Слайд 30End of the Chapter
Tank You Very Much
For Patient Listening






![1
CHAPTER IV
GROWTH AND ACCUMULATION Equation (2) says:Y/Y = [(1 - ) N/N] + ( Equation (2) says:Y/Y = [(1 - ) N/N] + ( K/K) + A/AHence:Y/Y = [N/N](/img/tmb/4/324797/66f70e0cad4dda7a7faf73b15ab98074-800x.jpg)


![1
CHAPTER IV
GROWTH AND ACCUMULATION 5. Cobb-Douglas Production Function Here: is share of capital to the 5. Cobb-Douglas Production Function Here: is share of capital to the GDP [For USA = 0.80]1-](/img/tmb/4/324797/9e9f43536f7e09973148df75ec62a8df-800x.jpg)
