Слайд 1Single-photon emission computed tomography (SPECT).
Single photon emission computed tomography (SPECT)
is a nuclear medicine tomographic imaging technique using gamma rays.
It is able to provide true 3D information. This information is typically presented as cross-sectional slices through the patient, but can be freely reformatted or manipulated as required.
The SPECT Principles
SPECT imaging is performed by using
a gamma camera to acquire multiple 2-D images (also called projections), from multiple angles. A computer is then used to apply a tomographic reconstruction algorithm to the multiple projections, yielding a 3-D dataset. This dataset may then be manipulated to show thin slices along any chosen axis of the body, similar to those obtained from other tomographic techniques, such as CT and PET.
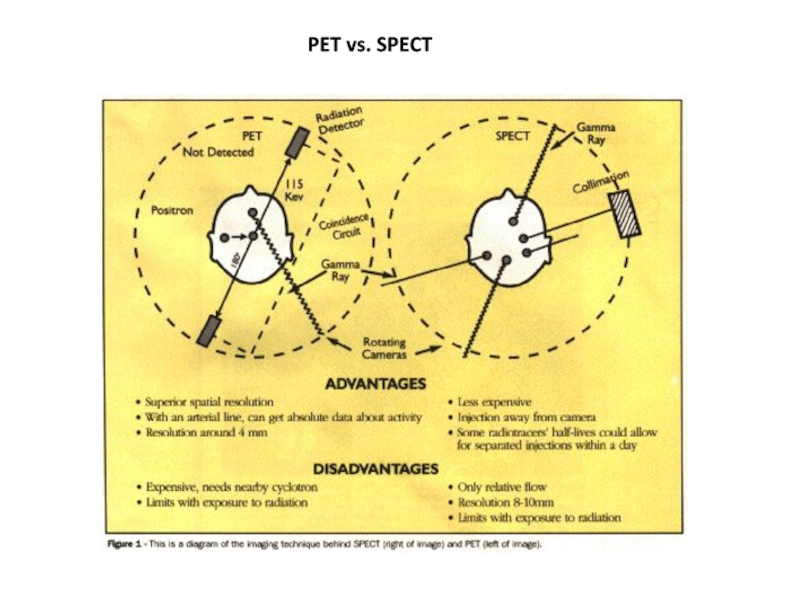
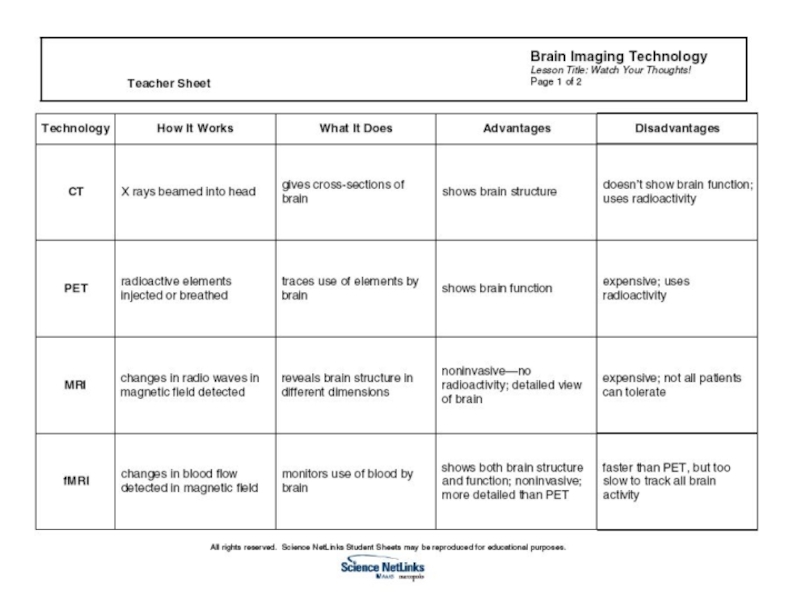
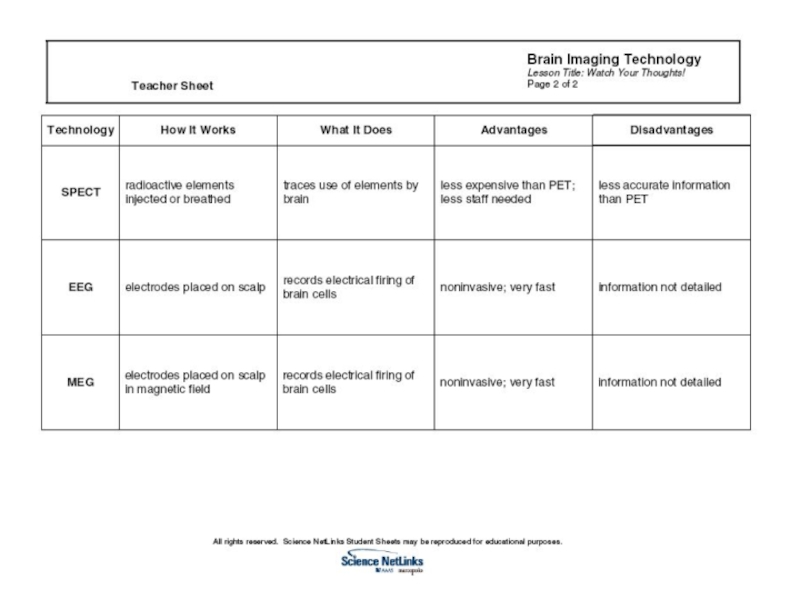
SPECT is similar to PET in its use of radioactive tracer material and detection of gamma rays. In contrast with PET, however, the tracer used in SPECT emits gamma radiation that is measured directly.
SPECT scans, however, are significantly less expensive than PET scans, in part because they are able to use longer-lived more easily-obtained radioisotopes than PET.
To acquire SPECT images, the gamma camera is rotated around the patient. Projections are acquired at defined points during the rotation, typically every 3-6 degrees; 360 degree rotation is used to obtain an optimal reconstruction.
Multi-headed gamma cameras can provide accelerated acquisition. For example, a dual headed camera can be used with heads spaced 180 degrees apart, allowing 2 projections to be acquired simultaneously, with each head requiring 180 degrees of rotation. Triple-head cameras with 120 degree spacing are also used.
Functional brain imaging
Usually the gamma-emitting
tracer used in functional brain imaging is 99mTc-HMPAO (hexamethylpropylene amine oxime). 99mTc (technetium-99m) is a metastable nuclear isomer which emits gamma rays which can be detected by a gamma camera. When it is attached to HMPAO, this allows 99mTc to be taken up by brain tissue in a manner proportional to brain blood flow, in turn allowing brain blood flow to be assessed with the nuclear gamma camera.
Because blood flow in the brain is tightly coupled to local brain metabolism and energy use, the 99mTc-HMPAO tracer (as well as the similar 99mTc-EC tracer) is used to assess brain metabolism regionally, in an attempt to diagnose and differentiate the different causal pathologies of dementia.
SPECT is more widely available (vs. PET), however, for the basic reason that the radioisotope generation technology is longer-lasting and far less expensive in SPECT, and the gamma scanning equipment is less expensive as well.
The reason for this is that 99mTc (technetium-99m, half-life, 6 hours) is extracted from relatively simple technetium-99m generators which are delivered to hospitals and scanning centers weekly.
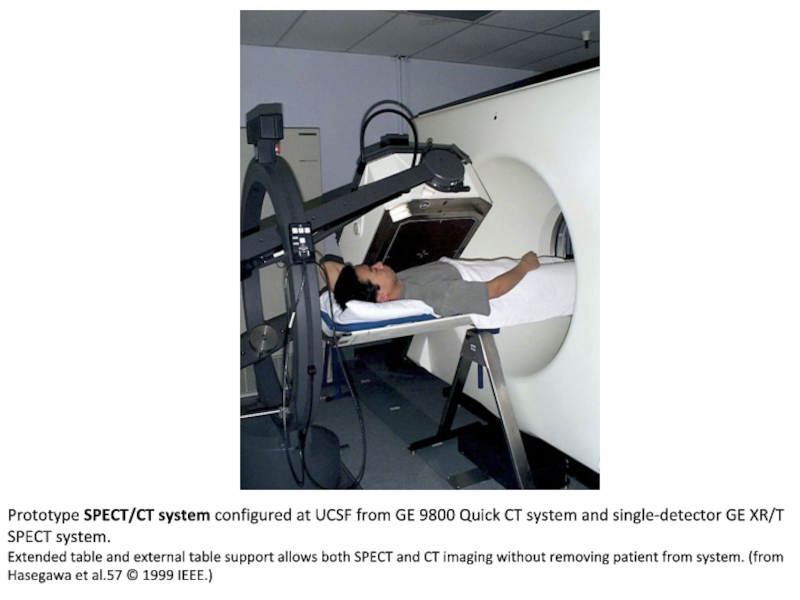
Слайд 4Prototype SPECT/CT system configured at UCSF from GE 9800 Quick
CT system and single-detector GE XR/T SPECT system.
Extended table and
external table support allows both SPECT and CT imaging without removing patient from system. (from Hasegawa et al.57 © 1999 IEEE.)
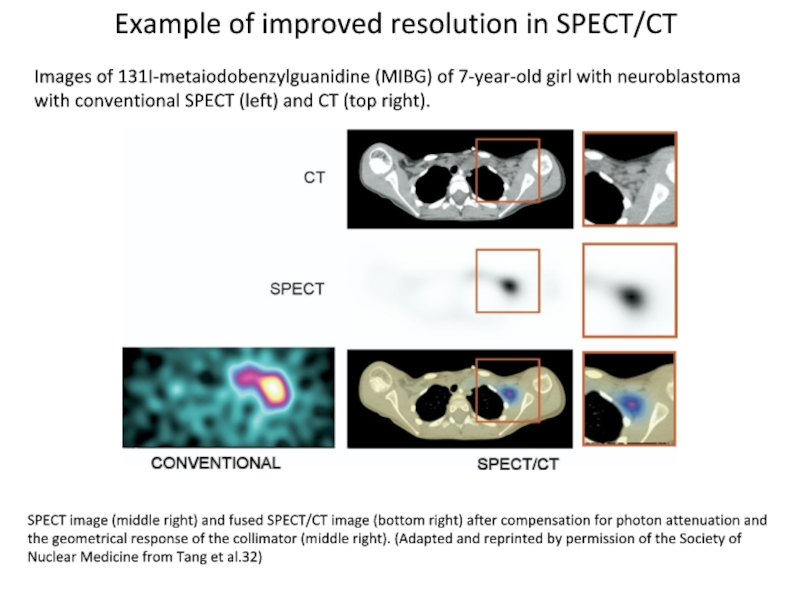
Слайд 5SPECT image (middle right) and fused SPECT/CT image (bottom right)
after compensation for photon attenuation and the geometrical response of
the collimator (middle right). (Adapted and reprinted by permission of the Society of Nuclear Medicine from Tang et al.32)
Images of 131I-metaiodobenzylguanidine (MIBG) of 7-year-old girl with neuroblastoma with conventional SPECT (left) and CT (top right).
Example of improved resolution in SPECT/CT
Слайд 9The magnetic resonance signal.
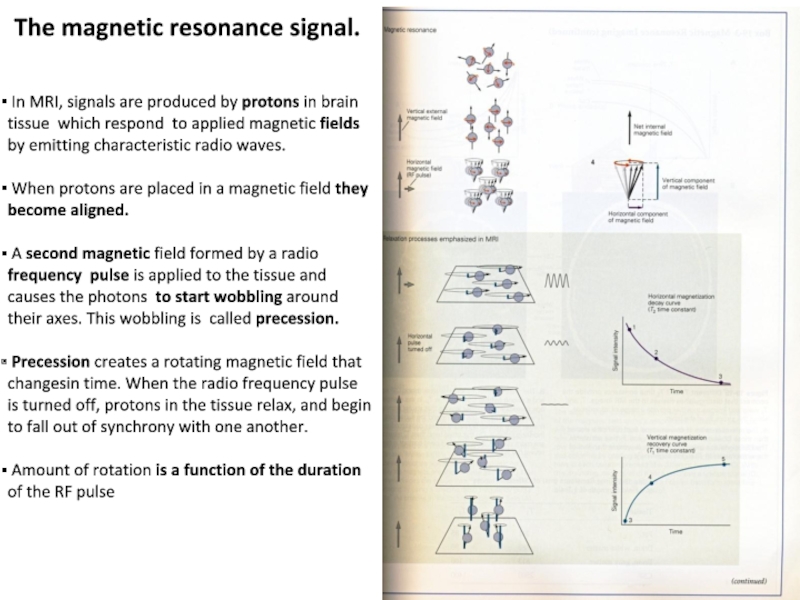
In MRI, signals are produced by
protons in brain tissue which respond to applied magnetic fields
by emitting characteristic radio waves.
When protons are placed in a magnetic field they become aligned.
A second magnetic field formed by a radio frequency pulse is applied to the tissue and causes the photons to start wobbling around their axes. This wobbling is called precession.
Precession creates a rotating magnetic field that changesin time. When the radio frequency pulse is turned off, protons in the tissue relax, and begin to fall out of synchrony with one another.
Amount of rotation is a function of the duration of the RF pulse
Слайд 10The magnetic resonance signal.
continue
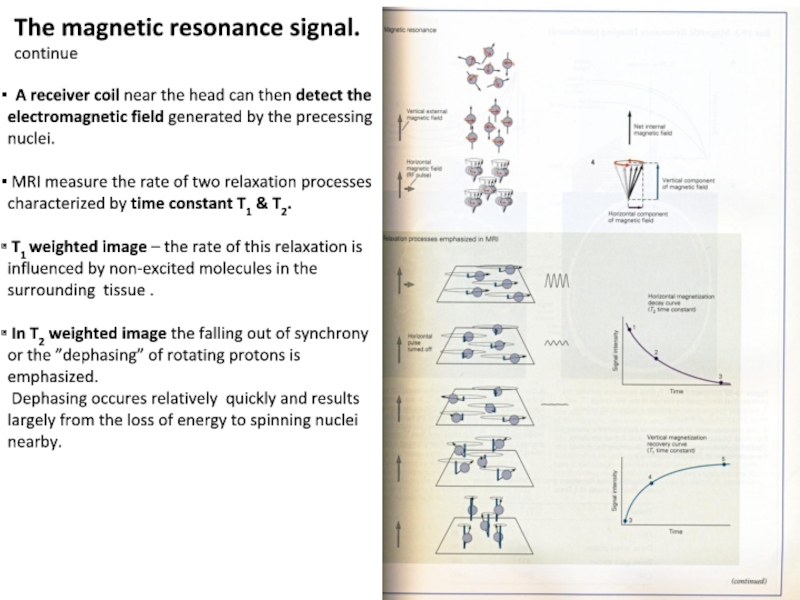
A receiver coil near the head
can then detect the electromagnetic field generated by the precessing
nuclei.
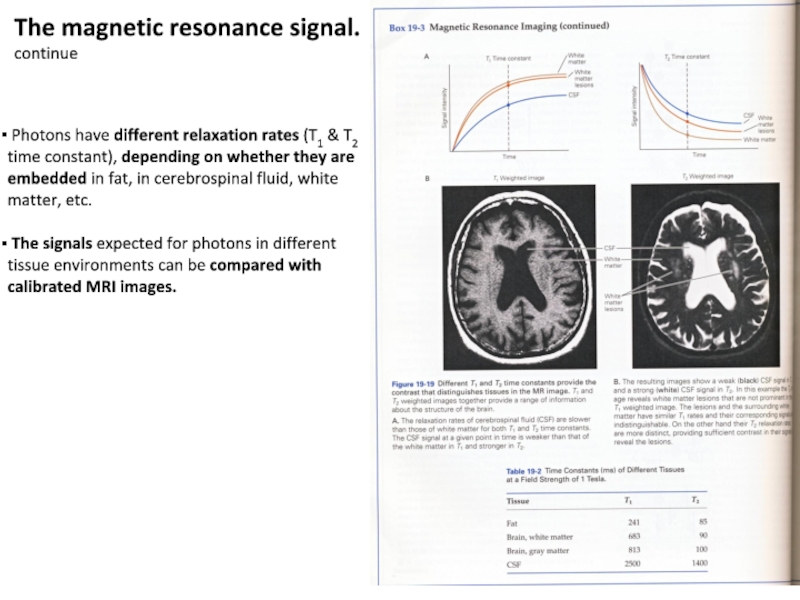
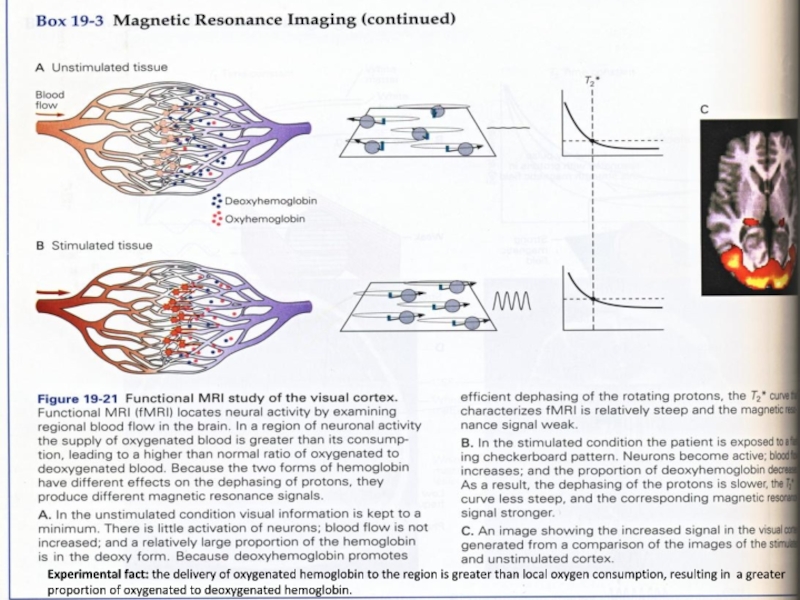
MRI measure the rate of two relaxation processes characterized by time constant T1 & T2.
T1 weighted image – the rate of this relaxation is
influenced by non-excited molecules in the surrounding tissue .
In T2 weighted image the falling out of synchrony or the ”dephasing” of rotating protons is emphasized.
Dephasing occures relatively quickly and results largely from the loss of energy to spinning nuclei nearby.
Слайд 11 Photons have different relaxation rates (T1 & T2 time
constant), depending on whether they are embedded in fat, in
cerebrospinal fluid, white matter, etc.
The signals expected for photons in different tissue environments can be compared with calibrated MRI images.
The magnetic resonance signal.
continue
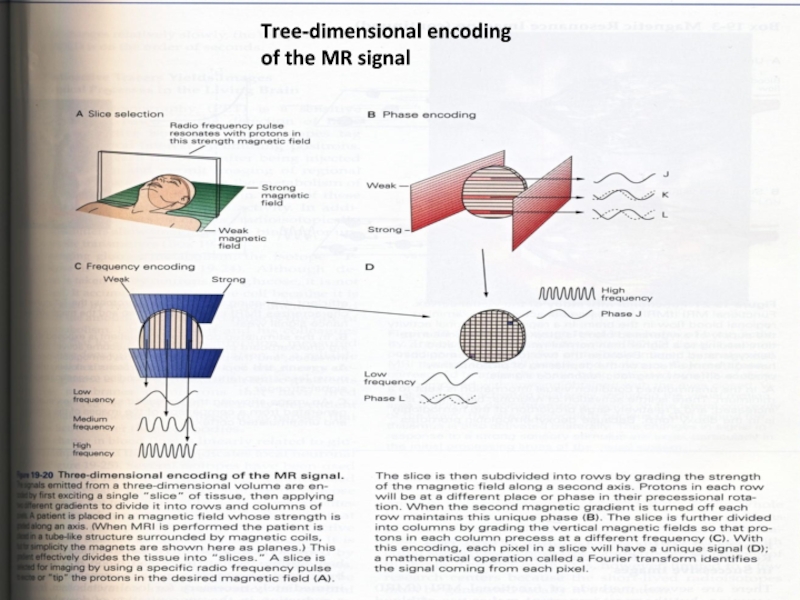
Слайд 12Tree-dimensional encoding
of the MR signal
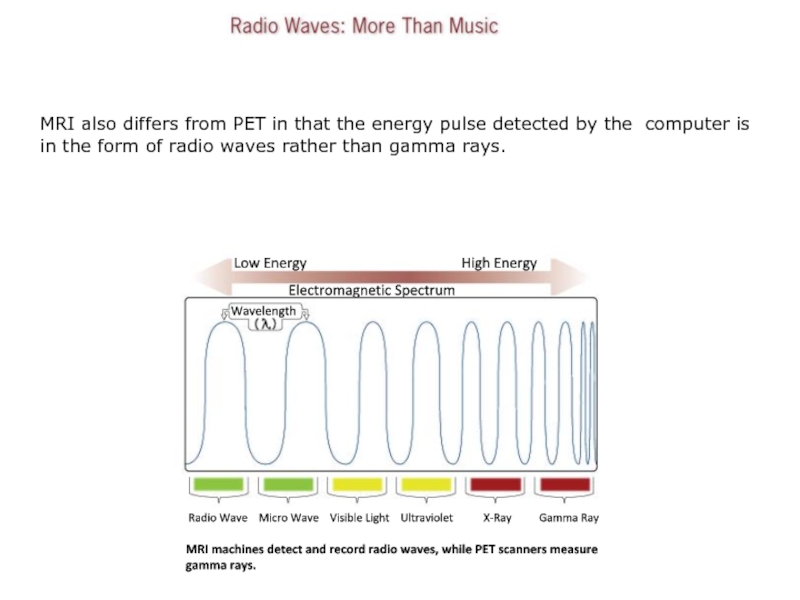
Слайд 13MRI also differs from PET in that the energy pulse
detected by the computer is in the form of radio
waves rather than gamma rays.
High Energy
Low Energy
Electromagnetic Spectrum
Wavelength
Radio Wave Micro Wave Visible Light Ultraviolet X-Ray Gamma Ray
MRI machines detect and record radio waves, while PET scanners measure
gamma rays.
Слайд 14Basic principles of MR imaging, cont.
Most commonly used
for MR imaging is the hydrogen atom, containing a single
proton.
In a 3T field, the hydrogen atom precesses at approximately 129 MHz.
Слайд 15Basic principles of MR imaging.
A fixed magnetic field is generated:
for ex., the fixed field is 3 Tesla (1 Tesla=10,000
Gauss).
By comparison, the earth’s magnetic field is .5 Gauss. Thus the static magnetic field of the scanner is 60,000X stronger than the earth’s magnetic field
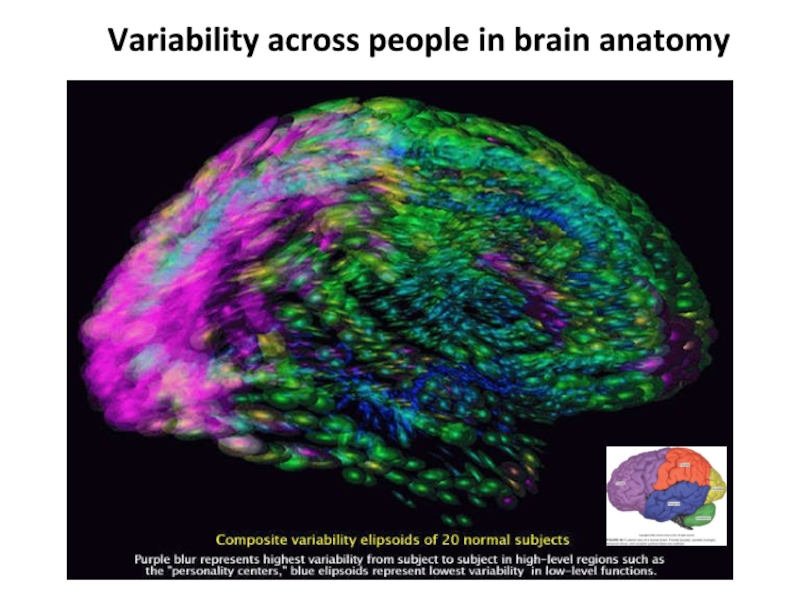
Слайд 16Variability across people in brain anatomy
Слайд 17Functional MRI (fMRI).
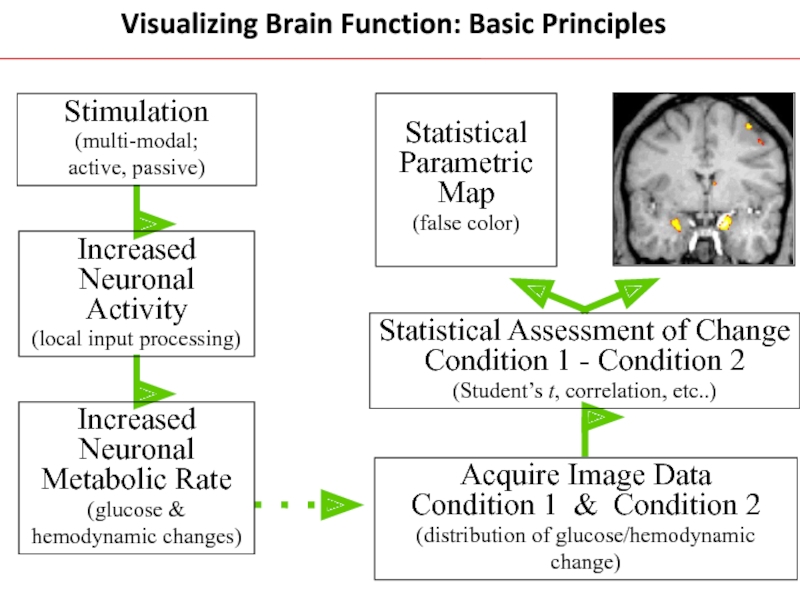
Functional magnetic resonance imaging (fMRI) is the use
of MRI to measure the hemodynamic response related to neural
activity in the brain or spinal cord of humans or other animals.
It is one of the most recently developed forms of neuroimaging.
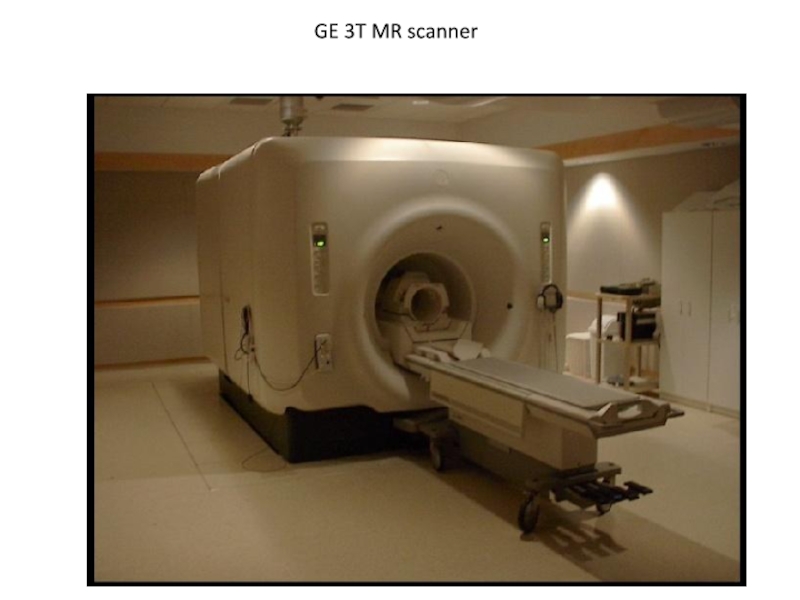
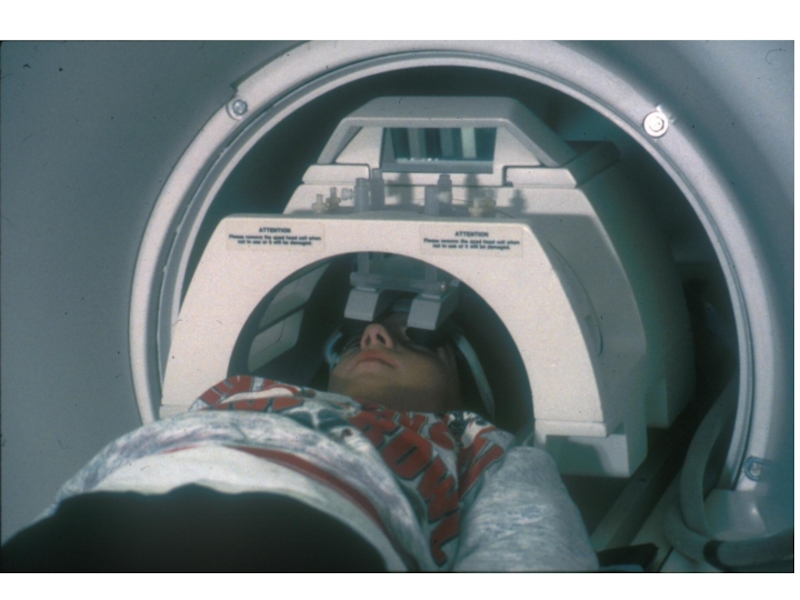
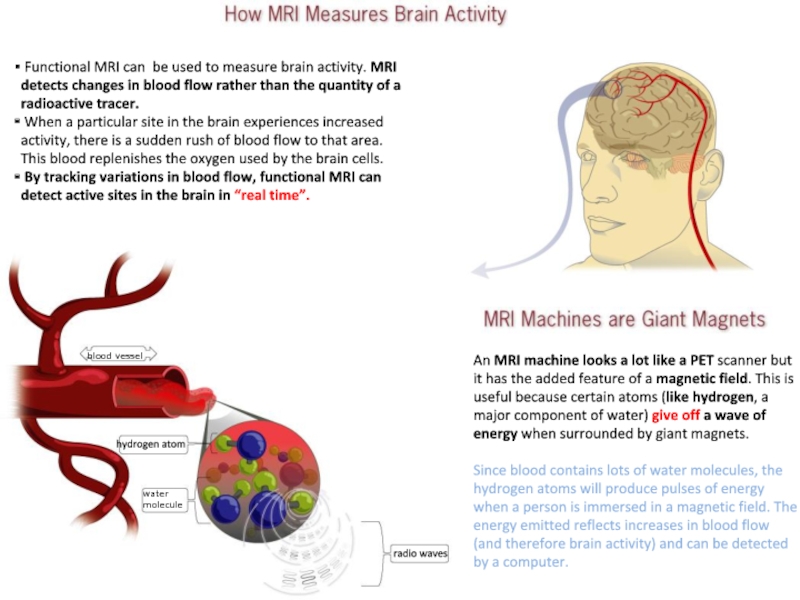
Слайд 18An MRI machine looks a lot like a PET scanner
but it has the added feature of a magnetic field.
This is useful because certain atoms (like hydrogen, a major component of water) give off a wave of energy when surrounded by giant magnets.
Since blood contains lots of water molecules, the hydrogen atoms will produce pulses of energy when a person is immersed in a magnetic field. The energy emitted reflects increases in blood flow (and therefore brain activity) and can be detected by a computer.
Functional MRI can be used to measure brain activity. MRI detects changes in blood flow rather than the quantity of a radioactive tracer.
When a particular site in the brain experiences increased activity, there is a sudden rush of blood flow to that area. This blood replenishes the oxygen used by the brain cells.
By tracking variations in blood flow, functional MRI can detect active sites in the brain in “real time”.
blood vessel
water
molecule
radio waves
hydrogen atom
Слайд 19Experimental fact: the delivery of oxygenated hemoglobin to the region
is greater than local oxygen consumption, resulting in a greater
proportion of oxygenated to deoxygenated hemoglobin.
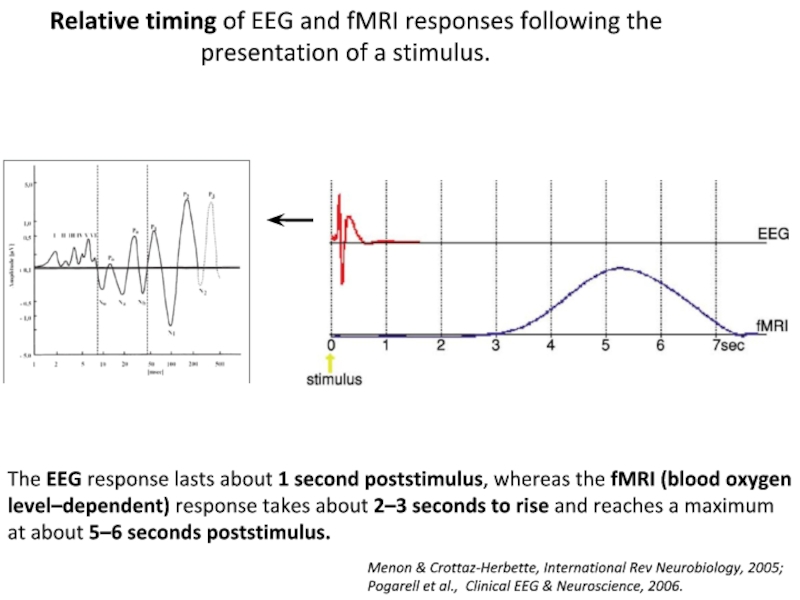
Слайд 20The EEG response lasts about 1 second poststimulus, whereas the
fMRI (blood oxygen level–dependent) response takes about 2–3 seconds to
rise and reaches a maximum at about 5–6 seconds poststimulus.
Relative timing of EEG and fMRI responses following the
presentation of a stimulus.
Menon & Crottaz-Herbette, International Rev Neurobiology, 2005;
Pogarell et al., Clinical EEG & Neuroscience, 2006.
Слайд 21The BOLD signal is composed of CBF contributions from larger
arteries and veins, smaller arterioles and venules, and capillaries.
Experimental
results indicate that the BOLD signal can be weighted to the smaller vessels, and hence closer to the active neurons, by using larger magnetic fields. For example, whereas about 70% of the BOLD signal arises from larger vessels in a 1.5 Tesla scanner, about 70% arises from smaller vessels in a 4 Tesla scanner.
Furthermore, the size of the BOLD signal increases roughly as the square of the magnetic field strength. Hence there has been a push for larger field scanners to both improve localization and increase the signal. A few 7 Tesla commercial scanners have become operational, and experimental 8 and 9 Tesla scanners are under development.
fMRI t can record signal from all regions of the brain, unlike EEG/MEG which are biased towards the cortical surface.
BOLD signal origin
Registration.
BOLD effects
are measured using rapid volumetric acquisition of images with contrast weighed by T1 or T2*.
Such images can be acquired with moderately good spatial and temporal resolution; images are usually taken every 1–4 seconds, and the voxels in the resulting image typically represent cubes of tissue about 2–4 millimeters on each side in humans.
Recent technical advancements, such as the use of high magnetic fields and multichannel RF reception, have advanced spatial resolution to the millimeter scale.
Although responses to stimuli presented as close together as one or two seconds can be distinguished from one another, using a method known as event-related fMRI.
Слайд 23Visualizing Brain Function: Basic Principles
Слайд 24Types of fMRI designs
Block design
Event-related design
Block design
In a blocked design, each of the task conditions comprising an experiment is performed for an extended period of time. Due to the additive nature of the hemodynamic response, the blocking of tightly spaced trials produces roughly homogeneous period of fMRI signals resulting from individual trials.
Event-related design
An
event-related design aims at characterizing the transient changes in fMRI signals that result from individual trials, which enables to randomly intermix trial types.
However, since the hemodynamic response starts to develop very shortly after the stimulus presentation or the beginning of the task but it takes about 5 sec to reach its peak, the time resolution of this technique is still limited to the order of seconds (Chein and Schneider, 2005; Otte and Halsband, 2006).
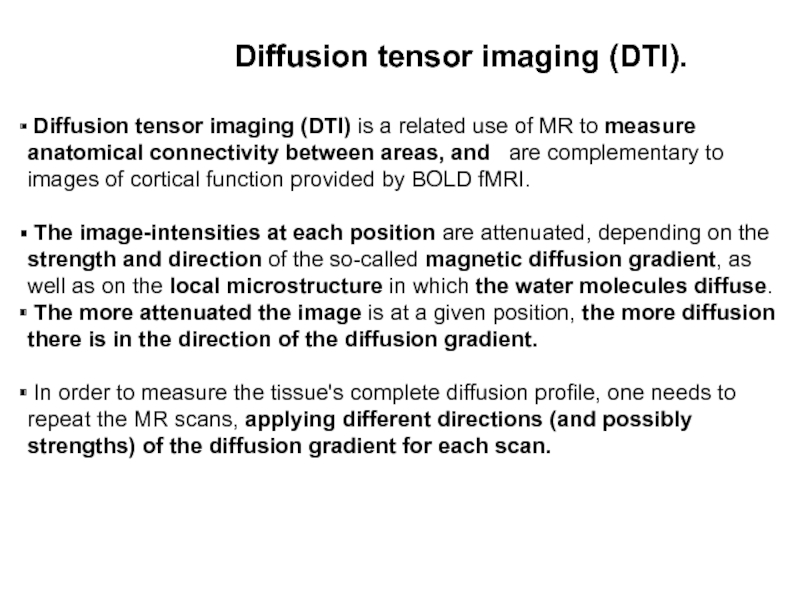
Diffusion tensor imaging (DTI).
Diffusion tensor imaging (DTI)
is a related use of MR to measure anatomical connectivity between areas, and are complementary to images of cortical function provided by BOLD fMRI.
The image-intensities at each position are attenuated, depending on the strength and direction of the so-called magnetic diffusion gradient, as well as on the local microstructure in which the water molecules diffuse.
The more attenuated the image is at a given position, the more diffusion there is in the direction of the diffusion gradient.
In order to measure the tissue's complete diffusion profile, one needs to repeat the MR scans, applying different directions (and possibly strengths) of the diffusion gradient for each scan.
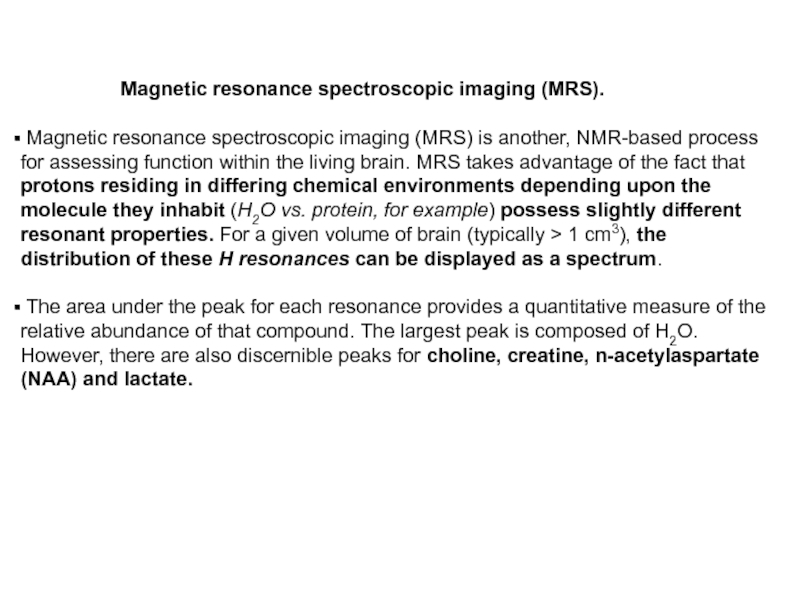
resonance spectroscopic imaging (MRS).
Magnetic resonance spectroscopic imaging (MRS) is
another, NMR-based process for assessing function within the living brain. MRS takes advantage of the fact that protons residing in differing chemical environments depending upon the molecule they inhabit (H2O vs. protein, for example) possess slightly different resonant properties. For a given volume of brain (typically > 1 cm3), the distribution of these H resonances can be displayed as a spectrum.
The area under the peak for each resonance provides a quantitative measure of the relative abundance of that compound. The largest peak is composed of H2O. However, there are also discernible peaks for choline, creatine, n-acetylaspartate (NAA) and lactate.
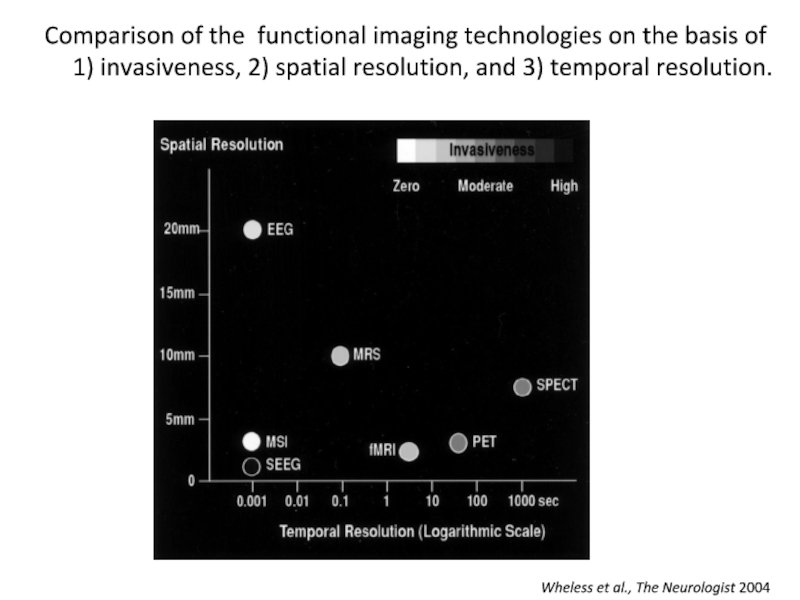
Слайд 31 Comparison of the functional imaging
technologies on the basis of
1) invasiveness, 2) spatial resolution, and 3) temporal resolution.
Wheless et al., The Neurologist 2004
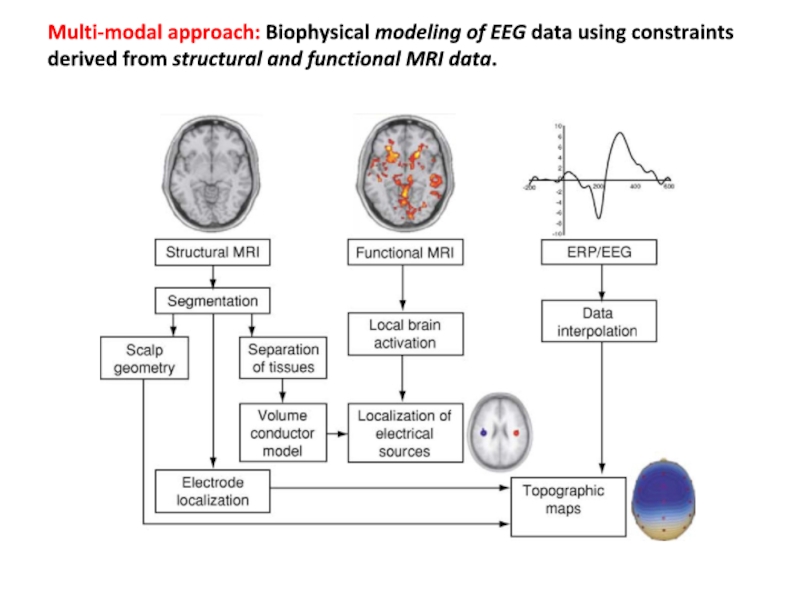
Слайд 32Multi-modal approach: Biophysical modeling of EEG data using constraints derived
from structural and functional MRI data.
