Разделы презентаций
- Разное
- Английский язык
- Астрономия
- Алгебра
- Биология
- География
- Геометрия
- Детские презентации
- Информатика
- История
- Литература
- Математика
- Медицина
- Менеджмент
- Музыка
- МХК
- Немецкий язык
- ОБЖ
- Обществознание
- Окружающий мир
- Педагогика
- Русский язык
- Технология
- Физика
- Философия
- Химия
- Шаблоны, картинки для презентаций
- Экология
- Экономика
- Юриспруденция
Study of heat transfer during evaporation and boiling of thin horizontal layers
Содержание
- 1. Study of heat transfer during evaporation and boiling of thin horizontal layers
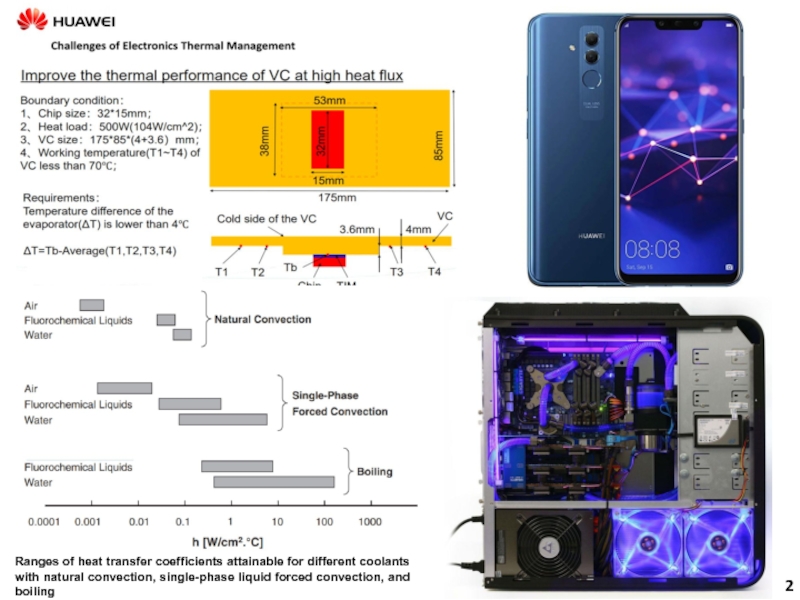
- 2. Ranges of heat transfer coefficients attainable for
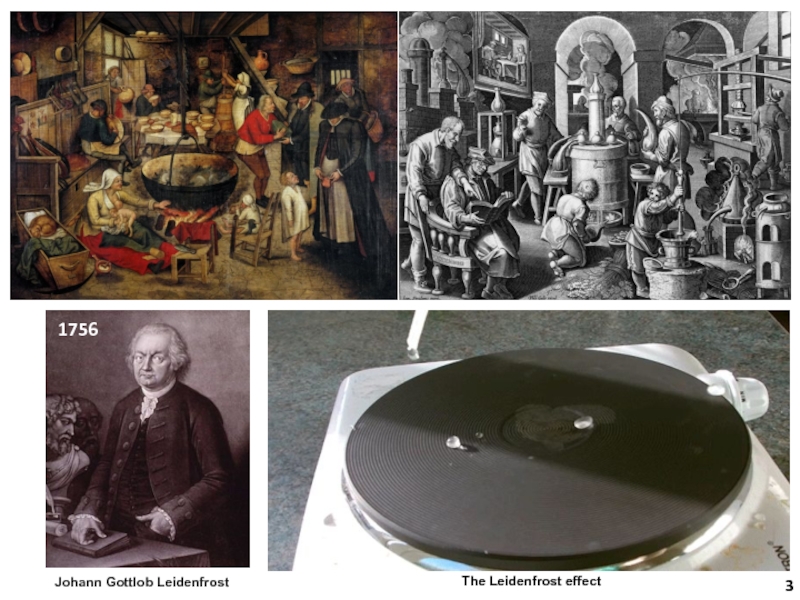
- 3. Johann Gottlob LeidenfrostThe Leidenfrost effect 1756
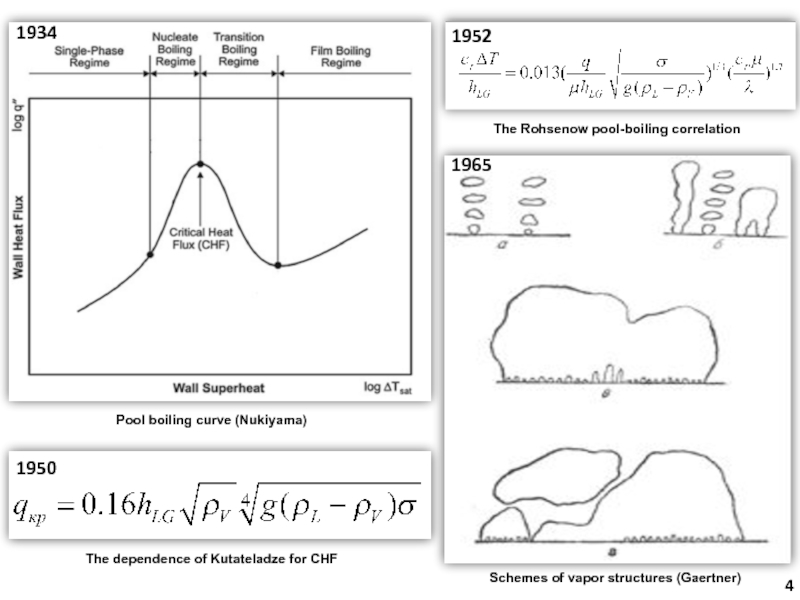
- 4. 195019651934Pool boiling curve (Nukiyama)Schemes of vapor structures (Gaertner)The dependence of Kutateladze for CHF1952The Rohsenow pool-boiling correlation
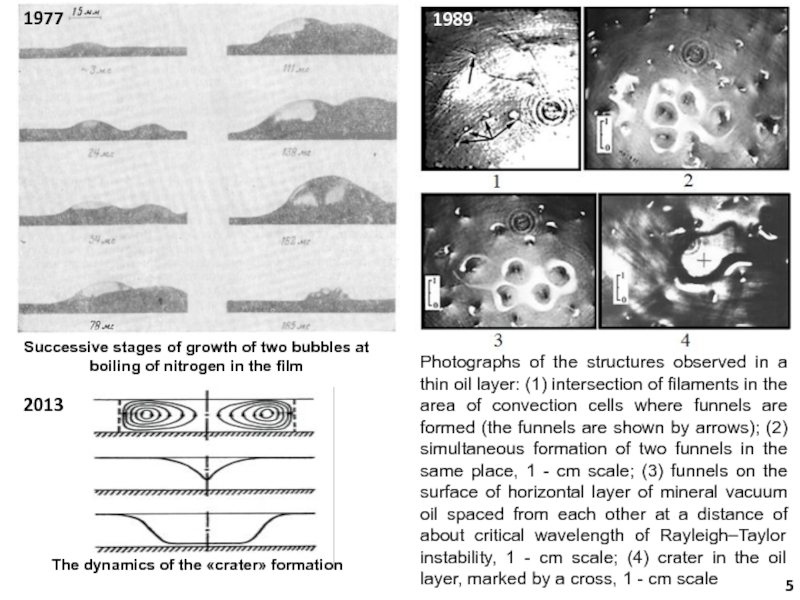
- 5. Successive stages of growth of two bubbles
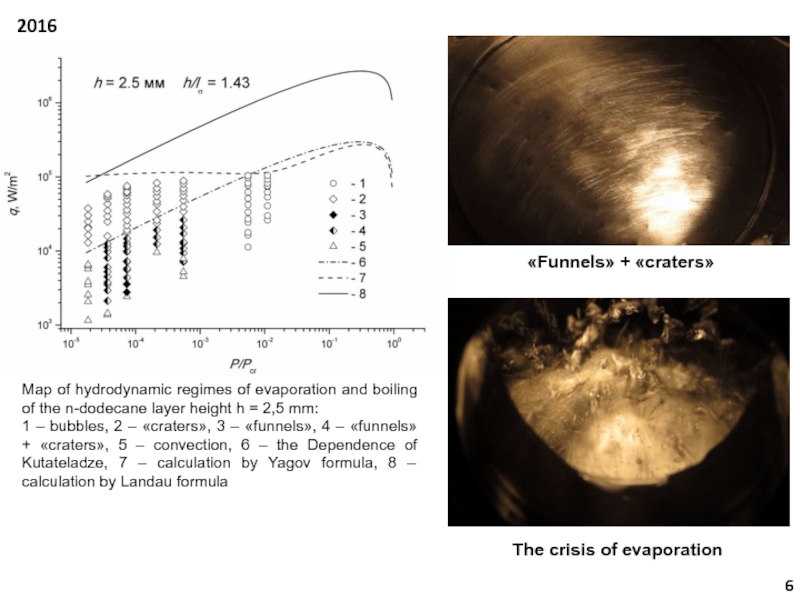
- 6. Map of hydrodynamic regimes of evaporation and
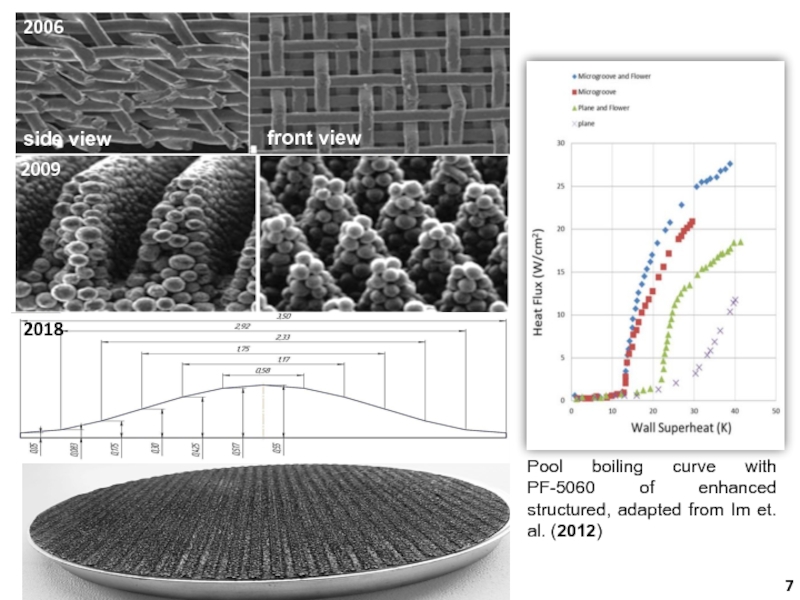
- 7. side viewfront view20062009Pool boiling curve with PF-5060 of enhanced structured, adapted from Im et. al. (2012)2018
- 8. Thanks for your attention!
- 9. Скачать презентанцию
Ranges of heat transfer coefficients attainable for different coolants with natural convection, single-phase liquid forced convection, and boiling
Слайды и текст этой презентации
Слайд 1Study of heat transfer during evaporation and boiling of thin
horizontal layers of liquid on a modified surface
Слайд 2Ranges of heat transfer coefficients attainable for different coolants with
natural convection, single-phase liquid forced convection, and boiling
Слайд 41950
1965
1934
Pool boiling curve (Nukiyama)
Schemes of vapor structures (Gaertner)
The dependence of
Kutateladze for CHF
1952
The Rohsenow pool-boiling correlation
Слайд 5Successive stages of growth of two bubbles at boiling of
nitrogen in the film
1977
Photographs of the structures observed in a
thin oil layer: (1) intersection of filaments in the area of convection cells where funnels are formed (the funnels are shown by arrows); (2) simultaneous formation of two funnels in the same place, 1 - cm scale; (3) funnels on the surface of horizontal layer of mineral vacuum oil spaced from each other at a distance of about critical wavelength of Rayleigh–Taylor instability, 1 - cm scale; (4) crater in the oil layer, marked by a cross, 1 - cm scale1989
2013
The dynamics of the «crater» formation
Слайд 6Map of hydrodynamic regimes of evaporation and boiling of the
n-dodecane layer height h = 2,5 mm:
1 – bubbles,
2 – «craters», 3 – «funnels», 4 – «funnels» + «craters», 5 – convection, 6 – the Dependence of Kutateladze, 7 – calculation by Yagov formula, 8 – calculation by Landau formula2016
«Funnels» + «craters»
The crisis of evaporation
