Разделы презентаций


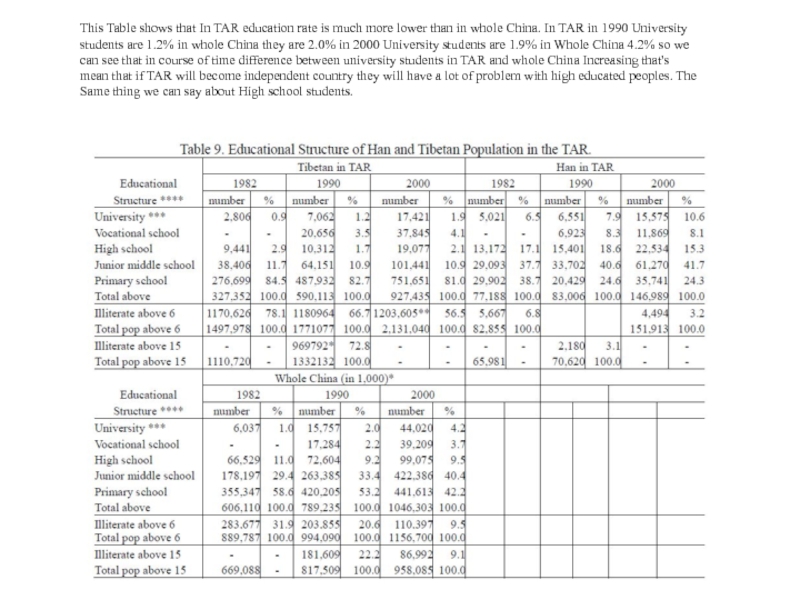
This Table shows that In TAR education rate is much more lower than in whole

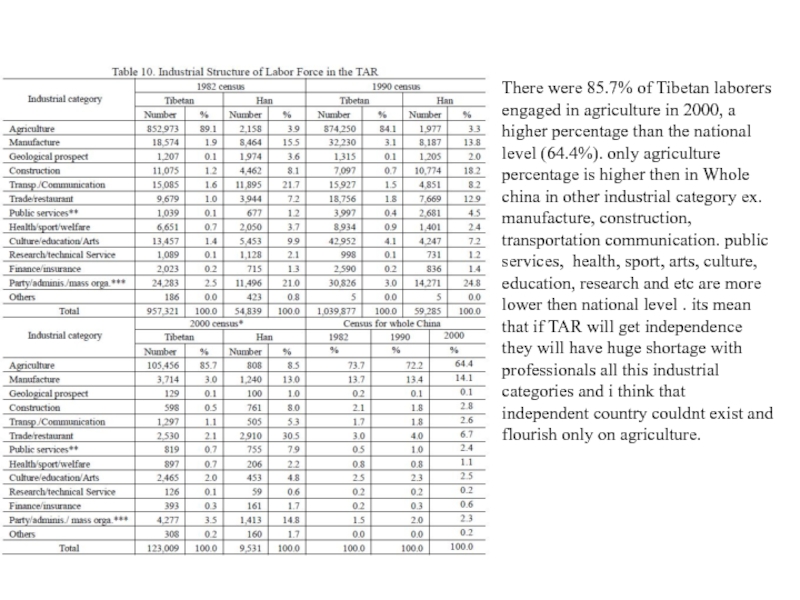
There were 85.7% of Tibetan laborers engaged in agriculture in 2000, a higher percentage than the national level (64.4%). only agriculture percentage is higher then in Whole china in other industrial
Слайды и текст этой презентации

Слайд 1This Table shows that In TAR education rate is much

more lower than in whole China. In TAR in 1990

University students are 1.2% in whole China they are 2.0% in 2000 University students are 1.9% in Whole China 4.2% so we can see that in course of time difference between university students in TAR and whole China Increasing that's mean that if TAR will become independent country they will have a lot of problem with high educated peoples. The Same thing we can say about High school students.
This Table shows that In TAR education rate is much more lower than in whole China. In

Слайд 2There were 85.7% of Tibetan laborers engaged in agriculture in

2000, a higher percentage than the national level (64.4%). only

agriculture percentage is higher then in Whole china in other industrial category ex. manufacture, construction, transportation communication. public services, health, sport, arts, culture, education, research and etc are more lower then national level . its mean that if TAR will get independence they will have huge shortage with professionals all this industrial categories and i think that independent country couldnt exist and flourish only on agriculture.
There were 85.7% of Tibetan laborers engaged in agriculture in 2000, a higher percentage than the national

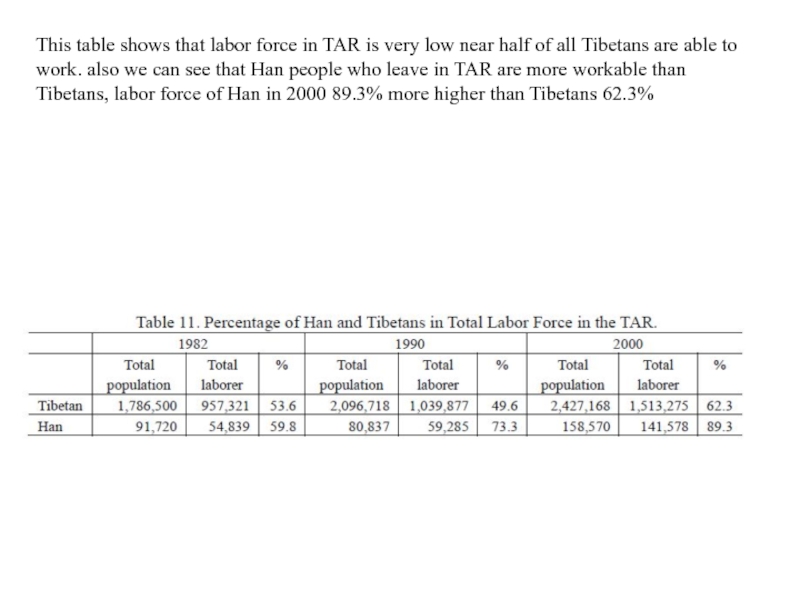
Слайд 3This table shows that labor force in TAR is very

low near half of all Tibetans are able to work.

also we can see that Han people who leave in TAR are more workable than Tibetans, labor force of Han in 2000 89.3% more higher than Tibetans 62.3%
This table shows that labor force in TAR is very low near half of all Tibetans are

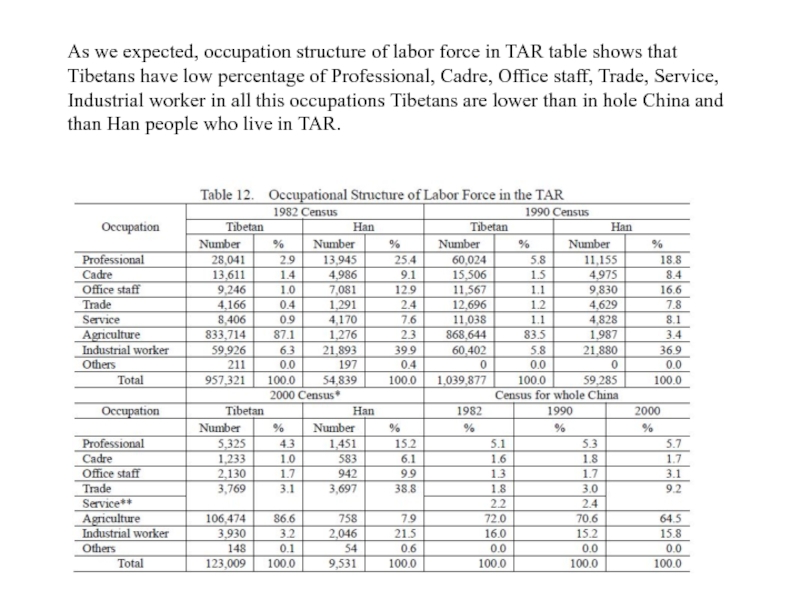
Слайд 4As we expected, occupation structure of labor force in TAR

table shows that Tibetans have low percentage of Professional, Cadre,

Office staff, Trade, Service, Industrial worker in all this occupations Tibetans are lower than in hole China and than Han people who live in TAR.
As we expected, occupation structure of labor force in TAR table shows that Tibetans have low percentage

Слайд 5Source- International Conference on “ Tibet Autonomy” at Harvard University

Source- International Conference on “ Tibet Autonomy” at Harvard University

Обратная связь

Если не удалось найти и скачать доклад-презентацию, Вы можете заказать его на нашем сайте. Мы постараемся найти нужный Вам материал и отправим по электронной почте. Не стесняйтесь обращаться к нам, если у вас возникли вопросы или пожелания:

Email: Нажмите что бы посмотреть 

Что такое TheSlide.ru?

Это сайт презентации, докладов, проектов в PowerPoint. Здесь удобно  хранить и делиться своими презентациями с другими пользователями.


Для правообладателей

Яндекс.Метрика