Слайд 1Capital Structure and Cost of Capital
Слайд 2Capital Structure
Concerned with the effect of capital
market decisions on security prices.
Assume:
(1) investment and asset management decisions are held constant and
(2) consider only debt-versus-equity financing.
Capital Structure -- The mix (or proportion) of a firm’s permanent long-term financing represented by debt, preferred stock, and common stock equity.
Слайд 3A Conceptual Look --Relevant Rates of Return
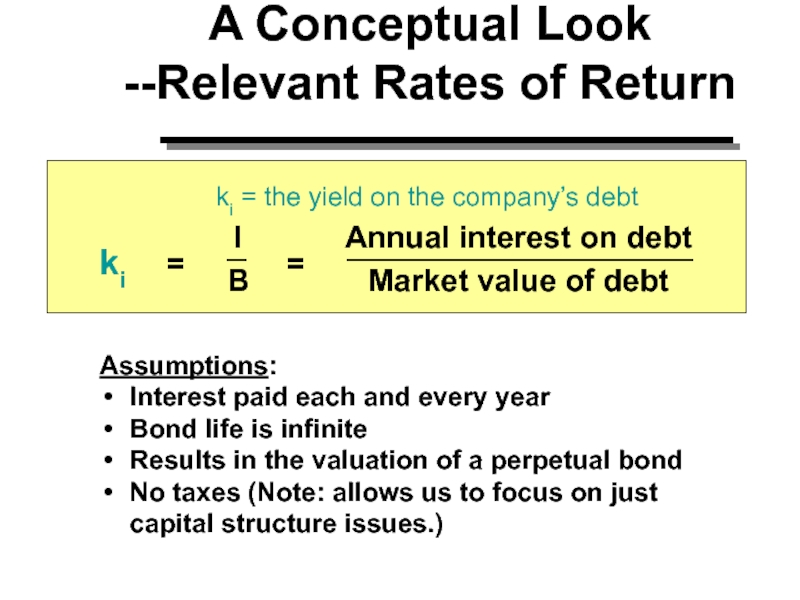
ki = the yield
on the company’s debt
Annual interest on debt
Market value of debt
I
B
=
=
ki
Assumptions:
Interest
paid each and every year
Bond life is infinite
Results in the valuation of a perpetual bond
No taxes (Note: allows us to focus on just capital structure issues.)
Слайд 4E
S
A Conceptual Look --Relevant Rates of Return
=
=
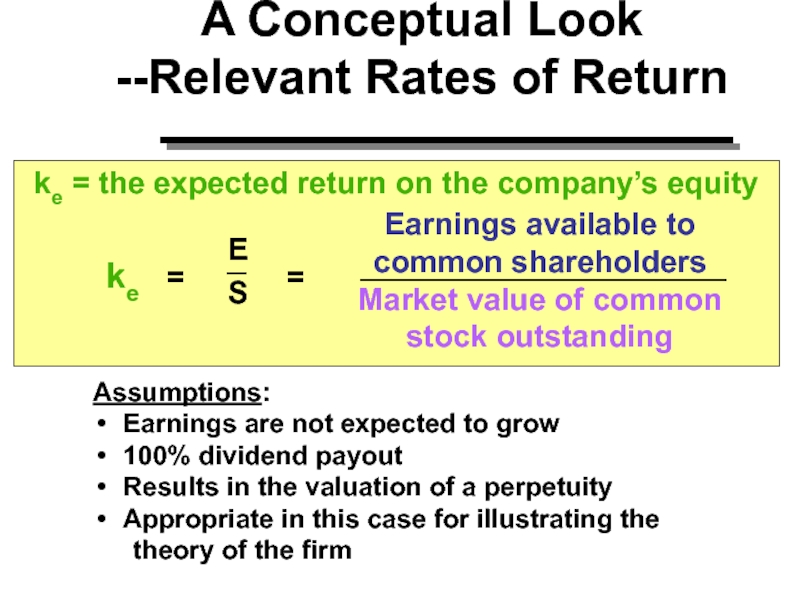
ke = the expected
return on the company’s equity
Earnings available to
common shareholders
Market value
of common
stock outstanding
ke
Assumptions:
Earnings are not expected to grow
100% dividend payout
Results in the valuation of a perpetuity
Appropriate in this case for illustrating the
theory of the firm
E
S
Слайд 5O
V
A Conceptual Look --Relevant Rates of Return
=
=
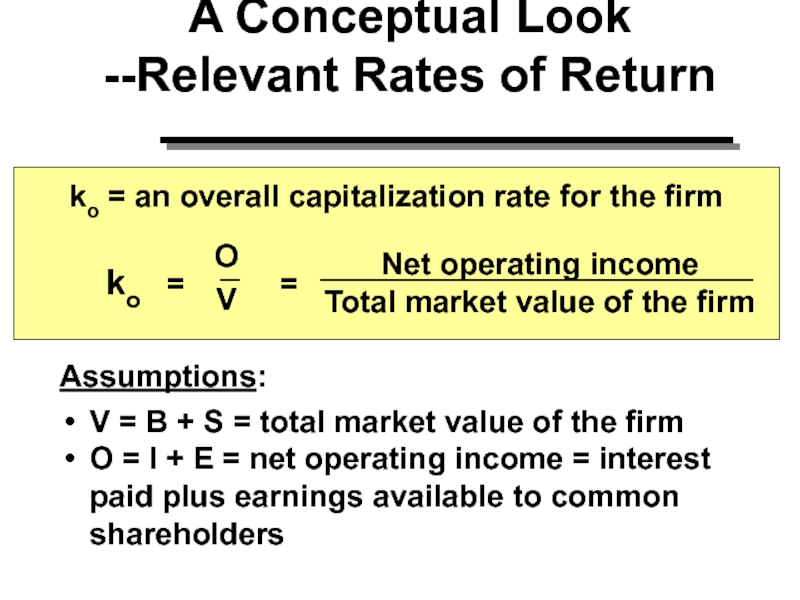
ko = an overall
capitalization rate for the firm
Net operating income
Total market value of
the firm
ko
Assumptions:
V = B + S = total market value of the firm
O = I + E = net operating income = interest paid plus earnings available to common shareholders
O
V
Слайд 6Capitalization Rate
Capitalization Rate, ko -- The discount rate used to
determine the present value of a stream of expected cash
flows.
ko
ke
ki
B
B + S
S
B + S
=
+
What happens to ki, ke, and ko
when leverage, B/S, increases?
Слайд 7Optimal Capital Structure
The objective of management is to maximise
shareholder wealth.
Is it possible to increase shareholder wealth by
changing the gearing ratio/level?
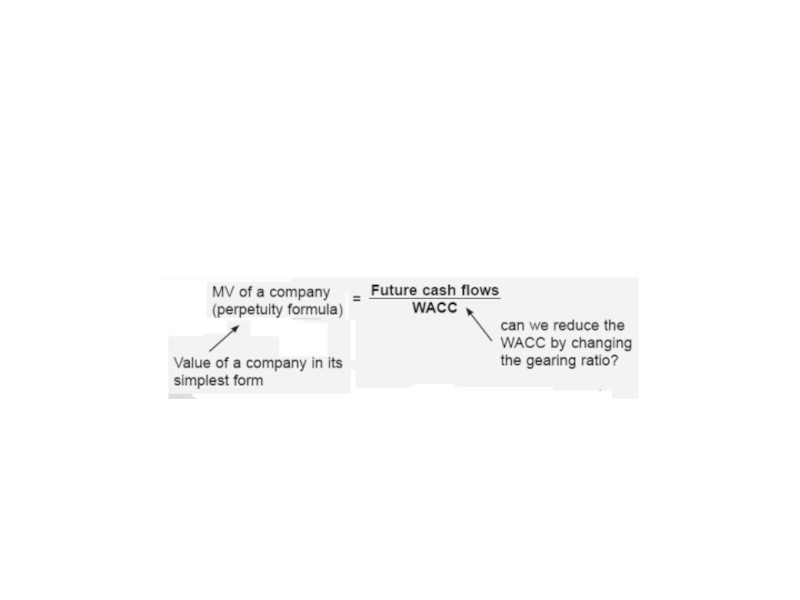
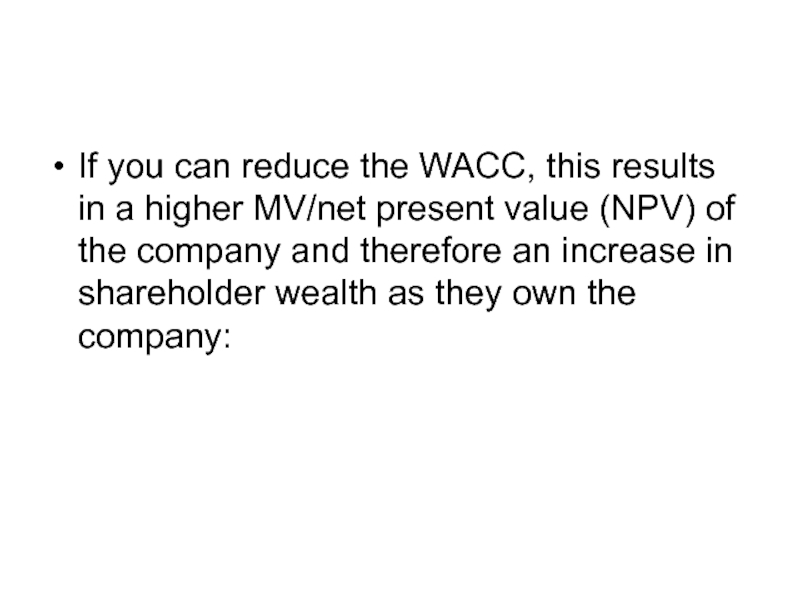
Слайд 9If you can reduce the WACC, this results in a
higher MV/net present value (NPV) of the company and therefore
an increase in shareholder wealth as they own the company:
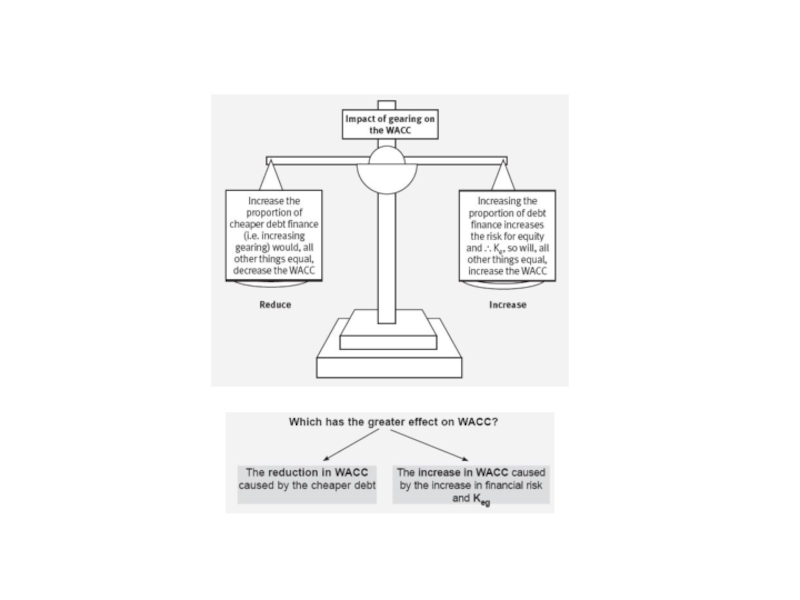
Слайд 10The WACC is a weighted average of the various sources
of finance used by the company.
Debt is cheaper than equity:
lower
risk
tax relief on interest
so you might expect that increasing the proportion of debt finance would reduce WACC.
but:
increasing levels of debt make equity more risky:
fixed commitment paid before equity – finance risk
so increasing gearing increases the cost of equity and that would increase the WACC.
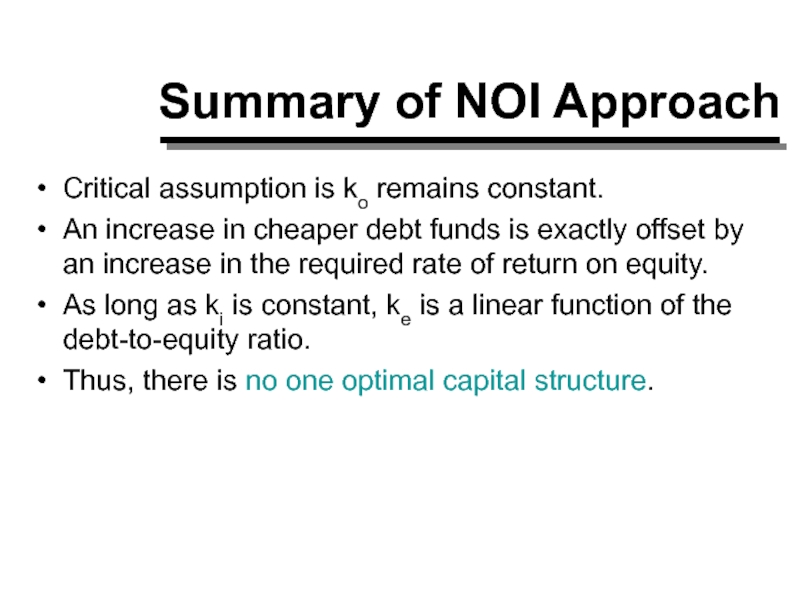
Слайд 12Summary of NOI Approach
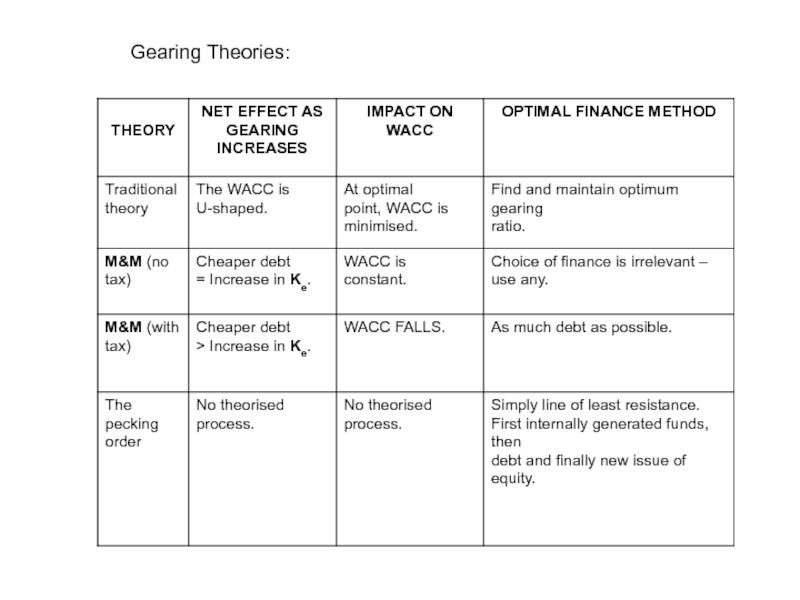
Critical assumption is ko remains constant.
An increase
in cheaper debt funds is exactly offset by an increase
in the required rate of return on equity.
As long as ki is constant, ke is a linear function of the debt-to-equity ratio.
Thus, there is no one optimal capital structure.
Слайд 14Traditional view of capital structure (intuitive view)
The traditional view
has no theoretical basis but common sense.
Taxation
is generally ignored in this view.
At low levels of gearing:
Equity holders perceive risk as unchanged so the increase in the proportion of cheaper debt will lower the WACC
At higher levels of gearing:
Equity holders see increased volatility of returns as debt interest must be paid first
increased financial risk
increase in Ke outweighs the extra (cheap) debt being introduced
WACC starts to rise.
At very high levels of gearing:
Serious bankruptcy risk worries equity and debt holders alike
Ke and Kd rise
WACC rises further.
Слайд 16Conclusion
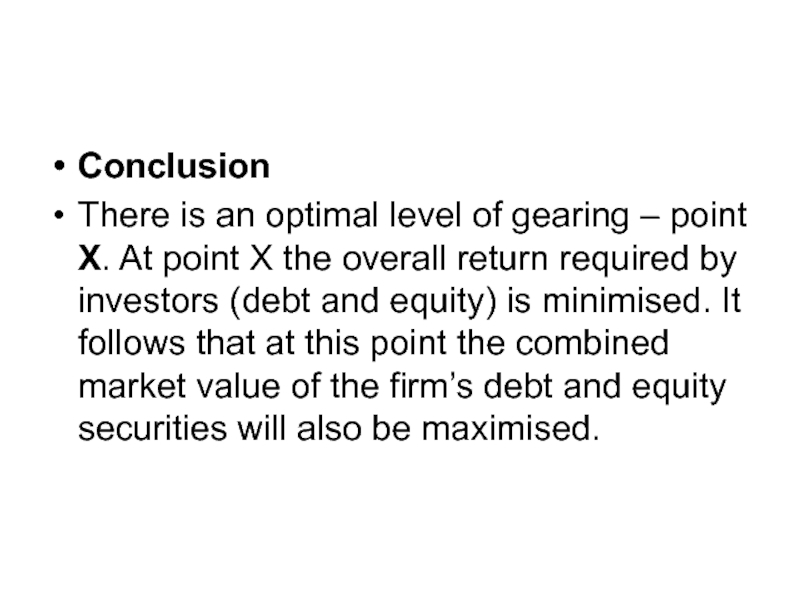
There is an optimal level of gearing – point X.
At point X the overall return required by investors (debt
and equity) is minimised. It follows that at this point the combined market value of the firm’s debt and equity securities will also be maximised.
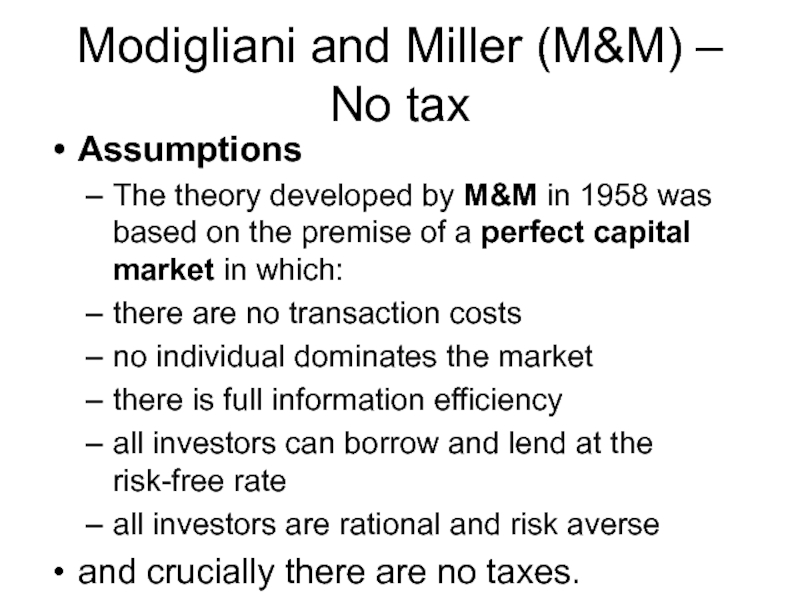
Слайд 17Modigliani and Miller (M&M) – No tax
Assumptions
The theory developed by
M&M in 1958 was based on the premise of a
perfect capital market in which:
there are no transaction costs
no individual dominates the market
there is full information efficiency
all investors can borrow and lend at the risk-free rate
all investors are rational and risk averse
and crucially there are no taxes.
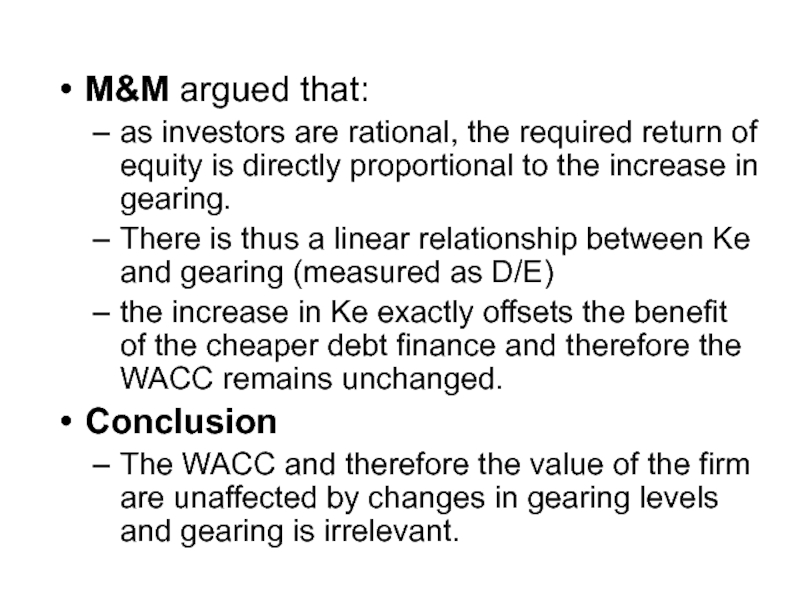
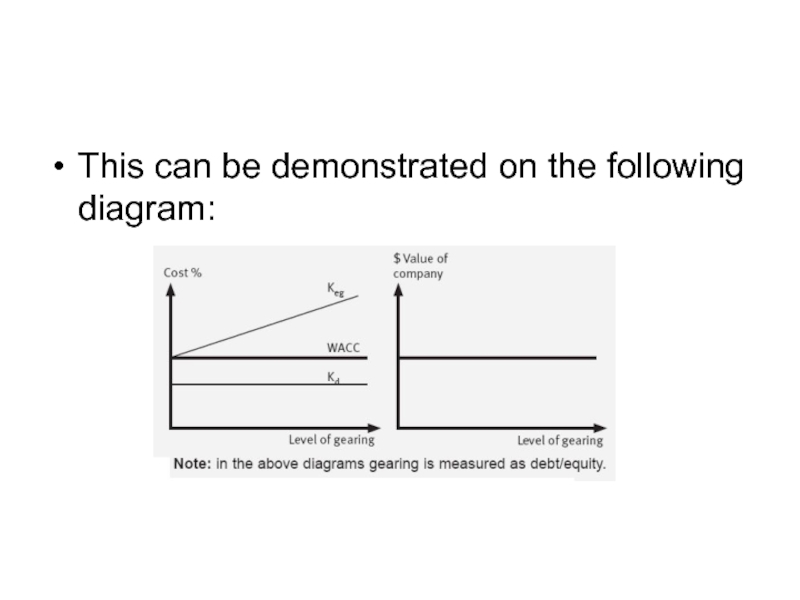
Слайд 18M&M argued that:
as investors are rational, the required return of
equity is directly proportional to the increase in gearing.
There
is thus a linear relationship between Ke and gearing (measured as D/E)
the increase in Ke exactly offsets the benefit of the cheaper debt finance and therefore the WACC remains unchanged.
Conclusion
The WACC and therefore the value of the firm are unaffected by changes in gearing levels and gearing is irrelevant.
Слайд 19This can be demonstrated on the following diagram:
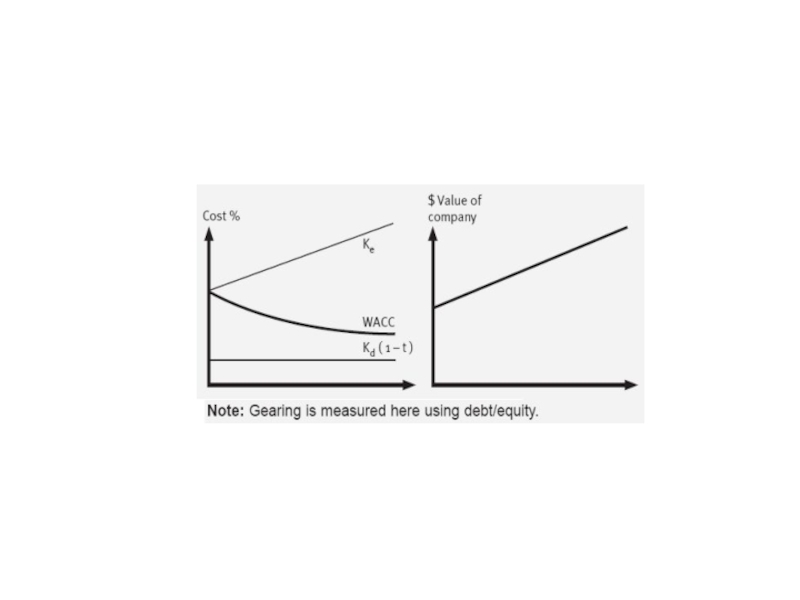
Слайд 20Modigliani and Miller (M&M) – with tax
M&M modified their model to reflect the fact that the
corporate tax system gives tax relief on interest payments.
The starting point for the theory is, as before, that:
as investors are rational, the required return of equity is directly linked to the increase in gearing – as gearing increases, Ke increases in direct proportion.
However this is adjusted to reflect the fact that:
debt interest is tax deductible so the overall cost of debt to the company is lower than in M&M – no tax
lower debt costs less volatility in returns for the same level of gearing lower increases in Ke
the increase in Ke does not offset the benefit of the cheaper debt finance and therefore the WACC falls as gearing increases.
Слайд 22The problems of high gearing
Bankruptcy risk
Agency costs
Tax exhaustion
Borrowing/debt capacity
Difference risk tolerance levels between shareholders and directors
Restrictions in the articles of association
The cost of borrowing increases as gearing increases
Слайд 23Pecking-order theory
In this approach, there is no
search for an optimal capital structure through a theorised process.
Instead it is argued that firms will raise new funds as follows:
internally-generated funds
debt
new issue of equity.
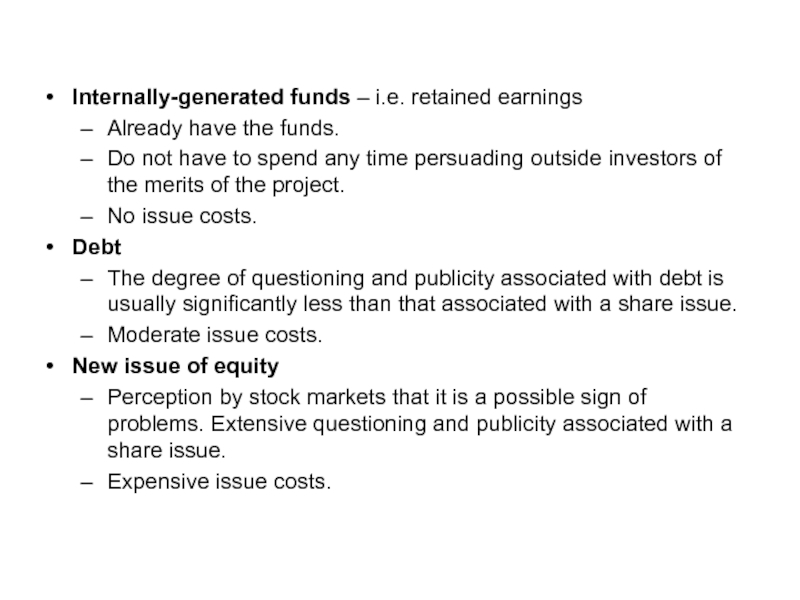
Слайд 24Internally-generated funds – i.e. retained earnings
Already have the funds.
Do not
have to spend any time persuading outside investors of the
merits of the project.
No issue costs.
Debt
The degree of questioning and publicity associated with debt is usually significantly less than that associated with a share issue.
Moderate issue costs.
New issue of equity
Perception by stock markets that it is a possible sign of problems. Extensive questioning and publicity associated with a share issue.
Expensive issue costs.
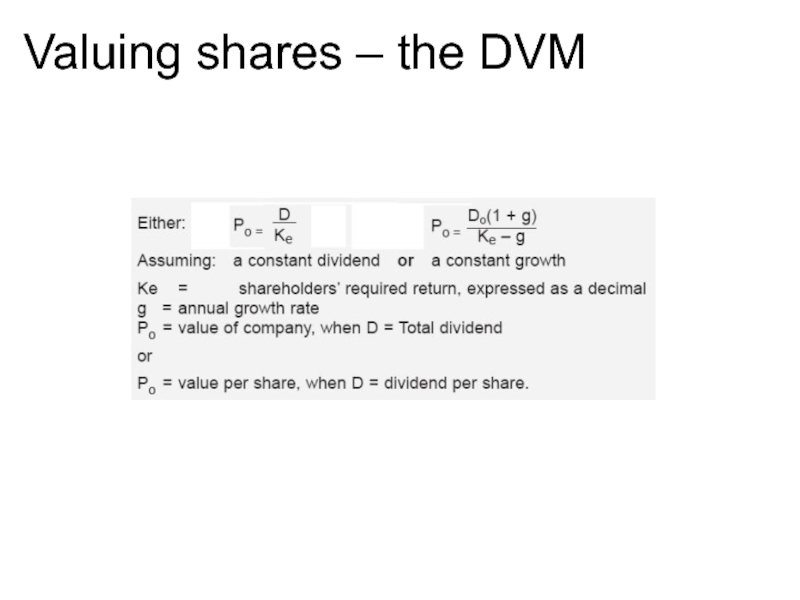
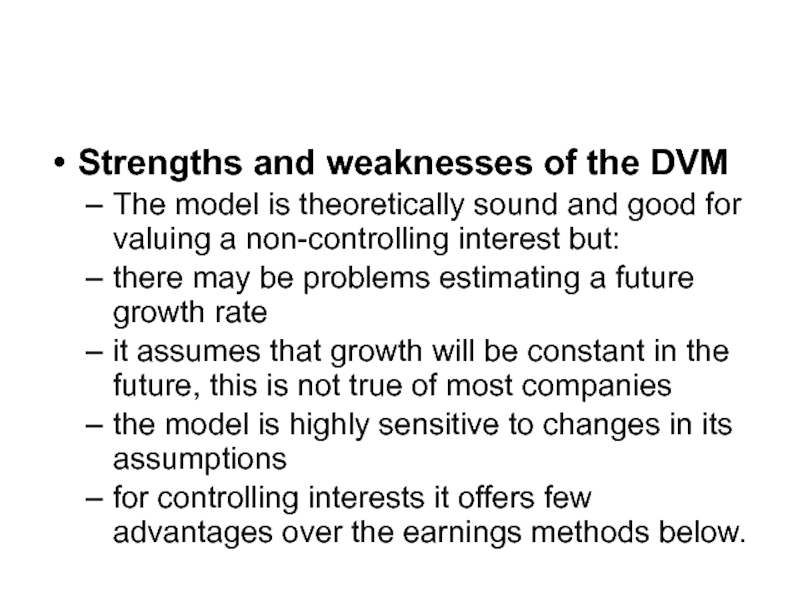
Слайд 27Strengths and weaknesses of the DVM
The model is theoretically sound
and good for valuing a non-controlling interest but:
there may be
problems estimating a future growth rate
it assumes that growth will be constant in the future, this is not true of most companies
the model is highly sensitive to changes in its assumptions
for controlling interests it offers few advantages over the earnings methods below.
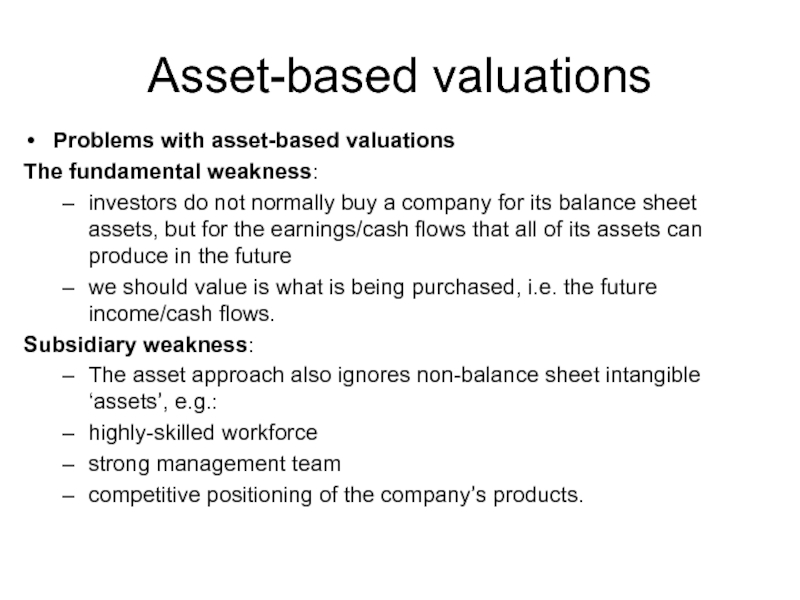
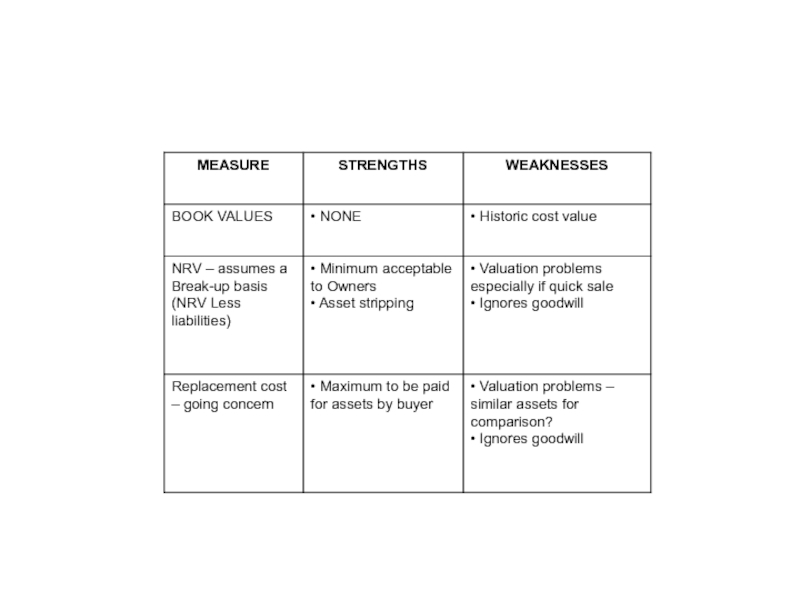
Слайд 28Asset-based valuations
Problems with asset-based valuations
The fundamental weakness:
investors do not
normally buy a company for its balance sheet assets, but
for the earnings/cash flows that all of its assets can produce in the future
we should value is what is being purchased, i.e. the future income/cash flows.
Subsidiary weakness:
The asset approach also ignores non-balance sheet intangible ‘assets’, e.g.:
highly-skilled workforce
strong management team
competitive positioning of the company’s products.
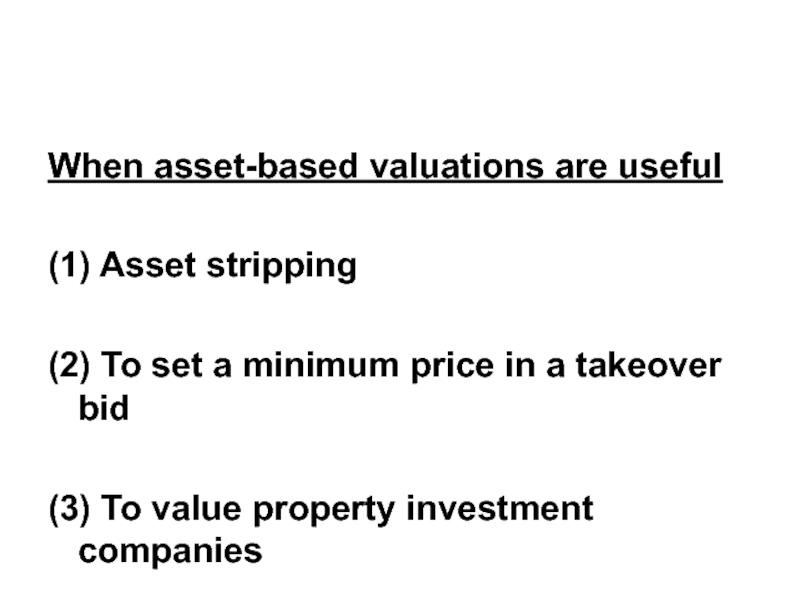
Слайд 29When asset-based valuations are useful
(1) Asset stripping
(2) To set
a minimum price in a takeover bid
(3) To value
property investment companies
