Разделы презентаций
- Разное
- Английский язык
- Астрономия
- Алгебра
- Биология
- География
- Геометрия
- Детские презентации
- Информатика
- История
- Литература
- Математика
- Медицина
- Менеджмент
- Музыка
- МХК
- Немецкий язык
- ОБЖ
- Обществознание
- Окружающий мир
- Педагогика
- Русский язык
- Технология
- Физика
- Философия
- Химия
- Шаблоны, картинки для презентаций
- Экология
- Экономика
- Юриспруденция
Costs of production Completed 222 group Plujnikova O Sultanova N Sarsembaeva
Содержание
- 1. Costs of production Completed 222 group Plujnikova O Sultanova N Sarsembaeva
- 2. Fixed and variable costsTotal fixed costsTotal variable costsTotal costsAverage fixed costsAreas for total costsSunk costsPLAN
- 3. Fixed and variable costsFixed costs are those
- 4. Total fixed costsGiven that total fixed costs (TFC) are
- 5. Total costsThe total cost (TC) curve is found by
- 6. Average fixed costsAverage fixed costs are found
- 7. Areas for total costsTotal Fixed costs and
- 8. Sunk costsSunk costs are those that cannot be
- 9. Thanks for attention
- 10. Скачать презентанцию
Fixed and variable costsTotal fixed costsTotal variable costsTotal costsAverage fixed costsAreas for total costsSunk costsPLAN
Слайды и текст этой презентации
Слайд 1Costs of production
Completed 222 group
Plujnikova O
Sultanova N
Sarsembaeva L
Khamraeva K
Rakhimova D
Слайд 3Fixed and variable costs
Fixed costs are those that do not
vary with output and typically include rents, insurance, depreciation, set-up
costs, and normal profit. They are also called overheads.Variable costs are costs that do vary with output, and they are also called direct costs. Examples of typical variable costs include fuel, raw materials, and some labour costs.
Слайд 4Total fixed costs
Given that total fixed costs (TFC) are constant as output
increases, the curve is a horizontal line on the cost
graph.Total variable costs
The total variable cost (TVC) curve slopes up at an accelerating rate, reflecting the law of diminishing marginal returns.
Слайд 5Total costs
The total cost (TC) curve is found by adding total fixed
and total variable costs. Its position reflects the amount of
fixed costs, and its gradient reflects variable costs.Слайд 6Average fixed costs
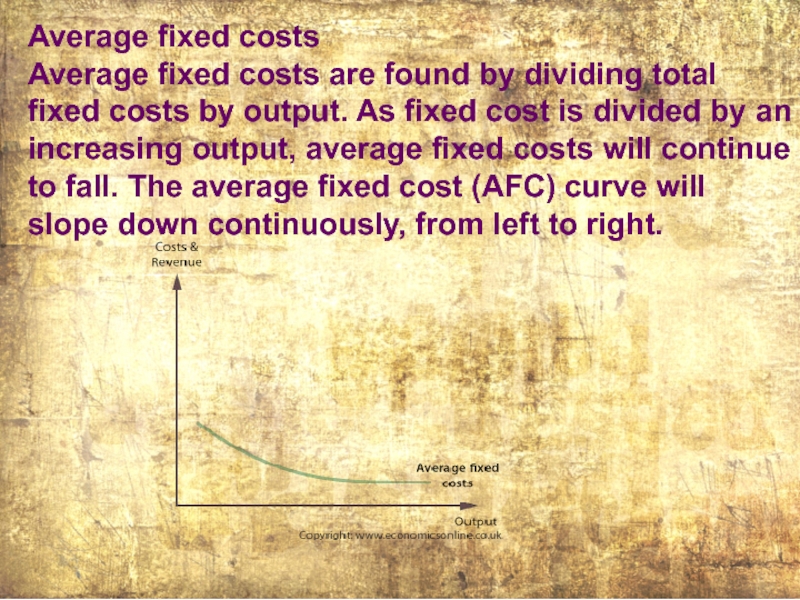
Average fixed costs are found by dividing total
fixed costs by output. As fixed cost is divided by
an increasing output, average fixed costs will continue to fall. The average fixed cost (AFC) curve will slope down continuously, from left to right.
Слайд 7Areas for total costs
Total Fixed costs and Total Variable costs
are the respective areas under the Average Fixed and Average
Variable cost curves.Слайд 8Sunk costs
Sunk costs are those that cannot be recovered if a
firm goes out of business. Examples of sunk costs include
spending on advertising and marketing, specialist machines that have no scrap value, and stocks which cannot be sold off.Sunk costs are a considerable barrier to entry and exit.
