Разделы презентаций
- Разное
- Английский язык
- Астрономия
- Алгебра
- Биология
- География
- Геометрия
- Детские презентации
- Информатика
- История
- Литература
- Математика
- Медицина
- Менеджмент
- Музыка
- МХК
- Немецкий язык
- ОБЖ
- Обществознание
- Окружающий мир
- Педагогика
- Русский язык
- Технология
- Физика
- Философия
- Химия
- Шаблоны, картинки для презентаций
- Экология
- Экономика
- Юриспруденция
Do you know the basics? The Key Financial Statements
Содержание
- 1. Do you know the basics? The Key Financial Statements
- 2. The Key Financial Statements. Learn your way
- 3. You can answer those questions by turning
- 4. These are the essential documents of business.
- 5. Outside investors use them to identify opportunities.
- 6. Every manager, no matter where he or
- 7. The Balance SheetCompanies prepare balance sheets to
- 8. Assets comprise all the physical resources a company
- 9. Liabilities are debts to suppliers and other creditors.
- 10. Owners’ equity is what’s left after you subtract
- 11. That definition gives rise to what is
- 12. The balance sheet shows assets on one
- 13. Suppose, for example, a computer company acquires
- 14. Now suppose that this company has $4
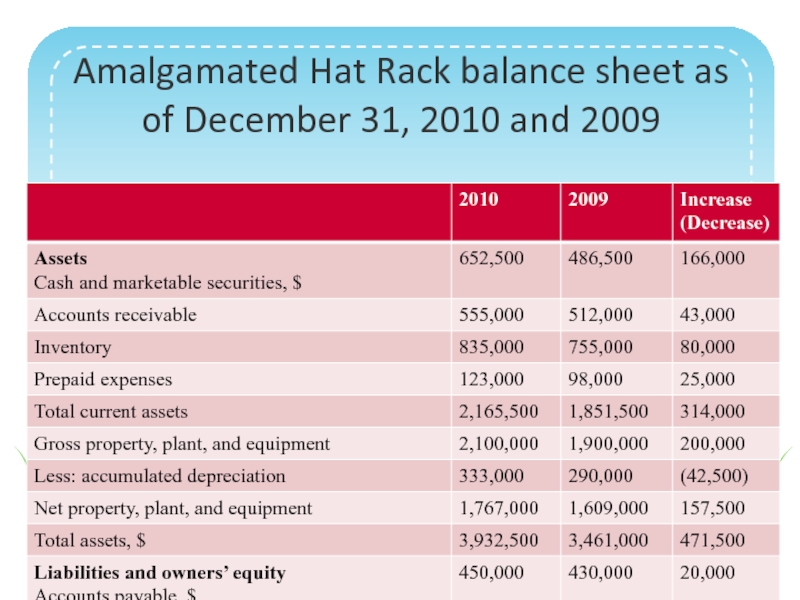
- 15. Notice how total assets equal total liabilities
- 16. Amalgamated Hat Rack balance sheet as of December 31, 2010 and 2009
- 17. Balance sheet data are most helpful when
- 18. AssetsListed first are current assets: cash on hand and
- 19. Since fixed assets other than land don’t
- 20. M&A can throw an additional asset category
- 21. Liabilities and owners’ equityNow let’s consider the
- 22. As explained earlier, subtracting total liabilities from
- 23. Historical CostBalance sheet figures may not correspond
- 24. If it was purchased in downtown San
- 25. If market values were required, then every public
- 26. How the Balance Sheet Relates to YouThough
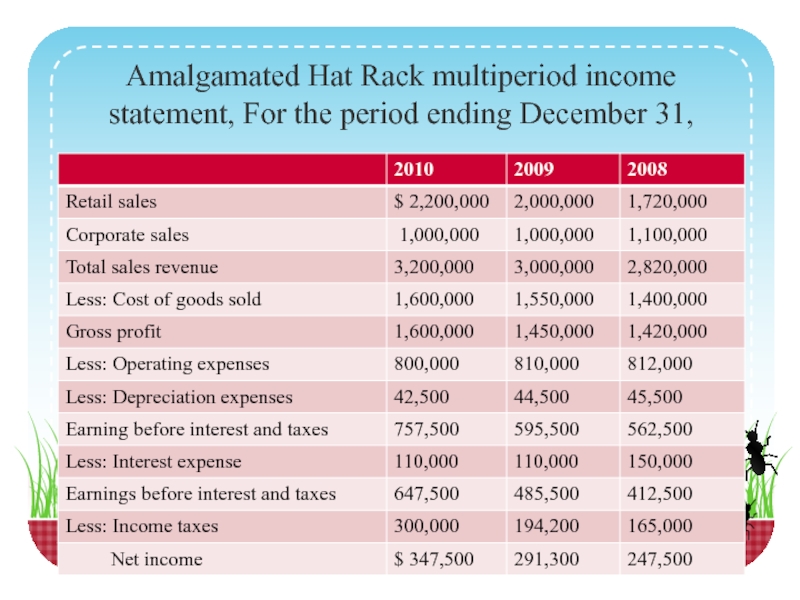
- 27. Working capitalSubtracting current liabilities from current assets
- 28. Financial managers give substantial attention to the
- 29. Inventory is a component of working capital that
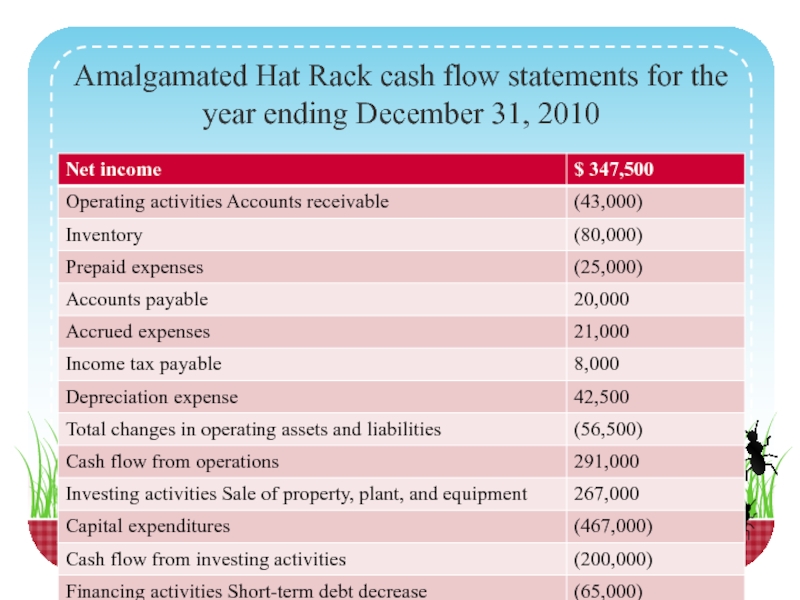
- 30. The company can fill customer orders without
- 31. The early years of the personal computer
- 32. By comparison, its rival, Dell, built computers
- 33. Finished Dell PCs didn’t end up on
- 34. Financial leverageThe use of borrowed money to
- 35. Financial leverage can increase returns on an
- 36. That’s a gain of 100% on your
- 37. But leverage can cut both ways. If
- 38. Financial structure of the firmThe negative potential
- 39. Although leverage enhances a company’s potential profitability
- 40. When creditors and investors examine corporate balance
- 41. The Income StatementUnlike the balance sheet, which
- 42. As we did with the balance sheet,
- 43. An income statement starts with the company’s sales, or revenues. This
- 44. Various expenses—the costs of making and storing
- 45. Let’s look at the various line items
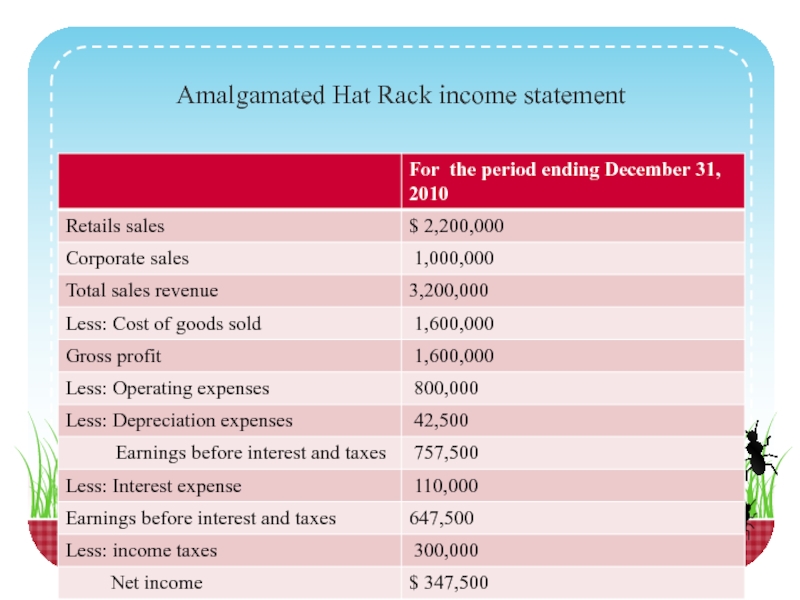
- 46. Amalgamated Hat Rack income statement
- 47. The next major category of cost is operating
- 48. Depreciation appears on the income statement as
- 49. Subtracting operating expenses and depreciation from gross
- 50. Multiyear ComparisonsAs with the balance sheet, comparing
- 51. In Amalgamated’s multiperiod income statement, you can
- 52. That’s a good sign that management is
- 53. How the Income Statement Relates to YouOf
- 54. Generating revenueIn one sense, nearly everyone in
- 55. It’s critical that managers in these departments
- 56. Managing budgetsRunning a department means working within
- 57. Close study of your company’s income statements
- 58. Managing a P&LMany managers have P&L responsibility,
- 59. Amalgamated Hat Rack multiperiod income statement, For the period ending December 31,
- 60. The Cash Flow StatementThe cash flow statement is the
- 61. The statement has three major categories: Operating activities, or operations, refers
- 62. Amalgamated Hat Rack cash flow statements for the year ending December 31, 2010
- 63. Again using the Amalgamated Hat Rack example,
- 64. The cash flow statement shows the relationship
- 65. Let’s look at each category on Amalgamated’s
- 66. The figure appearing on the cash flow
- 67. Investing activities. Amalgamated sold fixed assets—property, plant, and
- 68. Financing activities. Amalgamated decreased its short-term debt by
- 69. Change in cash. As noted above, the change
- 70. The cash flow statement is useful because
- 71. How the Cash Flow Statement Relates to
- 72. You may also have some influence over
- 73. If you are looking for even more
- 74. You can get 10-K reports and annual
- 75. Where to Find the FinancialsEvery company with
- 76. Private, or closely held, companies are not
- 77. Скачать презентанцию
The Key Financial Statements. Learn your way around a balance sheet, an income statement, and a cash flow statement.What does your company own, and what does it owe to others? What
Слайды и текст этой презентации
Слайд 1Do you know the basics?
The Key Financial Statements
Prepared:
Phd
Kargabayeva Saule Toleouvna
Слайд 2The Key Financial Statements. Learn your way around a balance sheet,
an income statement, and a cash flow statement.
What does your
company own, and what does it owe to others? What are its sources of revenue, and how has it spent its money?
How much profit has it made?
What is the state of its financial health?
Слайд 3You can answer those questions by turning to the three
main financial statements:
the balance sheet,
the income statement,
and the cash flow statement.
Слайд 4These are the essential documents of business. Executives use them
to assess performance and identify areas for action. Shareholders look
at them to keep tabs on how well their capital is being managed.Слайд 5Outside investors use them to identify opportunities. Lenders and suppliers
routinely examine them to determine the creditworthiness of the companies
with which they deal.Слайд 6Every manager, no matter where he or she sits in
the organization, should have a solid grasp of the basic
statements. All three follow the same general format from company to company, though specific line items may vary, depending on the nature of the business.Слайд 7The Balance Sheet
Companies prepare balance sheets to summarize their financial
position at a given point in time, usually at the
end of the month, the quarter, or the fiscal year. The balance sheet shows what the company owns (its assets), what it owes (its liabilities), and its book value, or net worth (also called owners’ equity, or shareholders’ equity).Слайд 8Assets comprise all the physical resources a company can put to
work in the service of the business. This category includes
cash and financial instruments (such as stocks and bonds), inventories of raw materials and finished goods, land, buildings, and equipment, plus the firm’s accounts receivable—funds owed by customers for goods or services purchased.Слайд 9Liabilities are debts to suppliers and other creditors. If a firm
borrows money from a bank, that’s a liability. If it
buys $1 million worth of parts—and hasn’t paid for those parts as of the date on the balance sheet—that $1 million is a liability. Funds owed to suppliers are known as accounts payable.Слайд 10Owners’ equity is what’s left after you subtract total liabilities from
total assets. A company with $3 million in total assets
and $2 million in liabilities has $1 million in owners’ equity.Слайд 11That definition gives rise to what is often called the
fundamental accounting equation:
Assets – Liabilities = Owners’ Equity or Assets = Liabilities + Owners’ Equity
Слайд 12The balance sheet shows assets on one side of the
ledger, liabilities and owners’ equity on the other. It’s called
a balance sheet because the two sides must always balance.Слайд 13Suppose, for example, a computer company acquires $1 million worth
of motherboards from an electronic parts supplier, with payment due
in 30 days. The purchase increases the company’s inventory assets by $1 million and its liabilities—in this case its accounts payable— by an equal amount. The equation stays in balance. Likewise, if the same company were to borrow $100,000 from a bank, the cash infusion would increase both its assets and its liabilities by $100,000.Слайд 14Now suppose that this company has $4 million in owners’
equity, and then $500,000 of uninsured assets burn up in
a fire. Though its liabilities remain the same, its owners’ equity—what’s left after all claims against assets are satisfied—drops to $3.5 million.Слайд 15Notice how total assets equal total liabilities plus owners’ equity
in the balance sheet of Amalgamated Hat Rack, an imaginary
company whose finances we will consider throughout this topic. The balance sheet describes not only how much the company has invested in assets but also what kinds of assets it owns, what portion comes from creditors (liabilities), and what portion comes from owners (equity).Слайд 17Balance sheet data are most helpful when compared with the
same information from one or more previous years. Amalgamated Hat
Rack’s balance sheet shows assets, liabilities, and owners’ equity for December 31, 2010, and December 31, 2009. Compare the figures, and you’ll see that Amalgamated is moving in a positive direction: It has increased its owners’ equity by $397,500.Слайд 18Assets
Listed first are current assets: cash on hand and marketable securities, receivables,
and inventory. Generally, current assets can be converted into cash
within one year. Next is a tally of fixed assets, which are harder to turn into cash. The biggest category of fixed assets is usually property, plant, and equipment; for some companies, it’s the only category.Слайд 19Since fixed assets other than land don’t last forever, the
company must charge a portion of their cost against revenue
over their estimated useful life. This is called depreciation, and the balance sheet shows the accumulated depreciation for all of the company’s fixed assets. Gross property, plant, and equipment minus accumulated depreciation equals the current book value of property, plant, and equipment.Слайд 20M&A can throw an additional asset category into the mix:
If one company has purchased another for a price above
the fair market value of its assets, the difference is known as goodwill, and it must be recorded. This is an accounting fiction, but goodwill often includes intangibles with real value, such as brand names, intellectual property, or the acquired company’s reputation.Слайд 21Liabilities and owners’ equity
Now let’s consider the claims against a
company’s assets. The category current liabilities represents money owed to creditors and
others that typically must be paid within a year. It includes short-term loans, accrued salaries, accrued income taxes, accounts payable, and the current year’s repayment obligation on a long-term loan. Long- term liabilities are usually bonds and mortgages—debts that the company is contractually obliged to repay over a period of time longer than a year.Слайд 22As explained earlier, subtracting total liabilities from total assets leaves
owners’ equity. Owners’ equity includes retained earnings (net profits that accumulate on
a company’s balance sheet after payment of dividends to shareholders) and contributed capital, or paid-in capital (capital received in exchange for shares).Слайд 23Historical Cost
Balance sheet figures may not correspond to actual market
values, except for items such as cash, accounts receivable, and
accounts payable. This is because accountants must record most items at their historical cost. If, for example, a company’s balance sheet indicated land worth $700,000, that figure would be what the company paid for the land way back when.Слайд 24If it was purchased in downtown San Francisco in 1960,
you can bet that it is now worth immensely more
than the value stated on the balance sheet. So why do accountants use historical in- stead of market values? The short answer is that it’s the lesser of two evils.Слайд 25If market values were required, then every public company would be
required to get a professional appraisal of every one of
its properties, warehouse inventories, and so forth, and would have to do so every year—a logistical nightmare.Слайд 26How the Balance Sheet Relates to You
Though the balance sheet
is prepared by accountants, it’s filled with important information for
nonfinancial managers. Later in this guide you’ll learn how to use balance- sheet ratios in managing your own area. For the moment, let’s just look at a couple of ways in which balance-sheet figures indicate how efficiently a company is operating.Слайд 27Working capital
Subtracting current liabilities from current assets gives you the
company’s net working capital, or the amount of money tied up in
current operations. A quick calculation from its most recent balance sheet shows that Amalgamated had $1,165,500 in net working capital at the end of 2010.Слайд 28Financial managers give substantial attention to the level of working
capital, which typically expands and contracts with the level of
sales. Too little working capital can put a company in a bad position: It may be unable to pay its bills or take advantage of profitable opportunities. But too much working capital reduces profitability since that capital must be financed in some way, usually through interest-bearing loans.Слайд 29Inventory is a component of working capital that directly affects many
nonfinancial managers. As with working capital in general, there’s a
tension between having too much and too little. On the one hand, plenty of inventory solves business problems.Слайд 30The company can fill customer orders without delay, and the
inventory pro vides a buffer against potential production stoppages or
interruptions in the flow of raw materials or parts. On the other hand, every piece of inventory must be financed, and the market value of the inventory itself may decline while it sits on the shelf.Слайд 31The early years of the personal computer business provided a
dramatic example of how excess inventory can wreck the bottom
line. Some analysts estimated that the value of finished-goods inventory—computers that had already been built—melted away at a rate of approximately 2% per day, because of technical obsolescence in this fast-moving industry. Inventory meltdown really hammered Apple during the mid-1990s.Слайд 32By comparison, its rival, Dell, built computers to order—so it
operated with no finished-goods inventory and with relatively small stocks of components.
Dell’s success formula was an ultrafast supply chain and assembly system that enabled the company to build PCs to customers’ specifications.Слайд 33Finished Dell PCs didn’t end up on stockroom shelves for
weeks at a time, but went directly from the assembly
line into waiting delivery trucks. The profit lesson to managers in this kind of situation is clear: Shape your operations to minimize inventories.Слайд 34Financial leverage
The use of borrowed money to acquire an asset
is called financial leverage. People say that a company is highly leveraged
when the percentage of debt on its balance sheet is high relative to the capital invested by the owners. (Operating leverage, in contrast, refers to the extent to which a company’s operating costs are fixed rather than variable.)Слайд 35Financial leverage can increase returns on an investment, but it
also increases risk. For example, suppose that you paid $400,000
for an asset, using $100,000 of your own money and $300,000 in borrowed funds. For simplicity, we’ll ignore loan payments, taxes, and any cash flow you might get from the investment. Four years go by, and your asset has appreciated to $500,000. Now you decide to sell. After paying off the $300,000 loan, you end up with $200,000 in your pocket — your original $100,000 plus a $100,000 profit.Слайд 36That’s a gain of 100% on your personal capital, even
though the asset increased in value by only 25%. Financial
leverage made this possible. If you had financed the purchase entirely with your own funds ($400,000), you would have ended up with only a 25% gain.Слайд 37But leverage can cut both ways. If the value of
an as- set drops, or if it fails to produce
the anticipated level of revenue, then leverage works against the asset’s owner. Consider what would have happened in our example if the asset’s value had dropped by $100,000—that is, to $300,000. The owner would still have to repay the initial loan of $300,000 and would have nothing left over. The entire $100,000 investment would have disappeared.Слайд 38Financial structure of the firm
The negative potential of financial leverage
is what keeps CEOs, their financial executives, and board members
from maximizing their companies’ debt financing. Instead, they seek a financial structure that creates a realistic balance between debt and equity on the balance sheet.Слайд 39Although leverage enhances a company’s potential profitability as long as
things go right, managers know that every dollar of debt
increases risk, both because of the danger just cited and because high debt entails high interest costs, which must be paid in good times and bad.Слайд 40When creditors and investors examine corporate balance sheets, therefore, they
look carefully at the debt- to-equity ratio. They factor the
riskiness of the balance sheet into the interest they charge on loans and the return they demand from a company’s bonds.Слайд 41The Income Statement
Unlike the balance sheet, which is a snapshot
of a company’s position at one point in time, the income
statement shows cumulative business results within a de- fined time frame, such as a quarter or a year. It tells you whether the company is making a profit or a loss—that is, whether it has positive or negative net income (net earnings)—and how much. This is why the income statement is often referred to as the profit-and-loss statement, or P&L. The income statement also tells you the company’s revenues and expenses during the time period it covers. Knowing the revenues and the profit enables you to determine the company’s profit margin.Слайд 42As we did with the balance sheet, we can represent
the contents of the income statement with a simple equation:
Revenues – Expenses = Net
IncomeСлайд 43An income statement starts with the company’s sales, or revenues. This is primarily the
value of the goods or services delivered to customers, but
you may have revenues from other sources as well. Note that revenues in most cases are not the same as cash. If a company delivers $1 million worth of goods in December 2010 and sends out an invoice at the end of the month, for example, that $1 million in sales counts as revenue for the year 2010 even though the customer hasn’t yet paid the bill.Слайд 44Various expenses—the costs of making and storing a company’s goods,
administrative costs, depreciation of plant and equipment, interest expense, and
taxes—are then deducted from revenues. The bottom line—what’s left over—is the net income (or net profit, or net earnings) for the period covered by the statement.Слайд 45Let’s look at the various line items on the income
statement for Amalgamated Hat Rack (see below). The cost of goods
sold, or COGS, represents the direct costs of manufacturing hat racks. This figure covers raw materials, such as lumber, and everything needed to turn those materials into finished goods, such as labor. Subtracting cost of goods sold from revenues gives us Amalgamated’s gross profit—an important measure of a company’s financial performance. In 2010, gross profit was $1,600,000.Слайд 47 The next major category of cost is operating expenses, which include the
salaries of administrative employees, office rents, sales and marketing costs,
and other costs not directly related to making a product or delivering a service.Слайд 48Depreciation appears on the income statement as an expense, even
though it involves no out-of-pocket payment. As described earlier, it’s
a way of allocating the cost of an asset over the asset’s estimated useful life. A truck, for example, might be expected to last five years.Слайд 49Subtracting operating expenses and depreciation from gross profit gives you
a company’s operating earnings, or operating profit. This is often called earnings before interest and
taxes, or EBIT, as it is on Amalgamated’s statement.Слайд 50Multiyear Comparisons
As with the balance sheet, comparing income statements over
a period of years reveals much more than examining a
single income statement. You can spot trends, turnarounds, and recurring problems.Слайд 51In Amalgamated’s multiperiod income statement, you can see that annual
retail sales have grown steadily, while corporate sales have declined
slightly. Operating expenses have stayed about the same, however, even as total sales have expanded.Слайд 52That’s a good sign that management is holding the line
on the cost of doing business. Interest expense has also
declined, perhaps because the company has paid off one of its loans. The bottom line, net income, shows healthy growth.Слайд 53How the Income Statement Relates to You
Of the three main
financial statements, the income statement generally has the greatest bearing
on a manager’s job. That’s because most managers are responsible in some way for one or more of its elements:Слайд 54Generating revenue
In one sense, nearly everyone in a company helps
generate revenue—the people who design and produce the goods or
deliver the service, those who deal directly with customers, and so on—but it’s the primary responsibility of the sales and marketing departments.Слайд 55It’s critical that managers in these departments understand the income
statement so that they can balance costs against revenue. If
sales reps give too many discounts, for instance, they may reduce the company’s gross profit.Слайд 56Managing budgets
Running a department means working within the confines of
a budget. If you oversee a unit in information technology
or human resources, for example, you may have little influence on revenue, but you will surely be expected to watch your costs closely—and all those costs will affect the income statement.Слайд 57Close study of your company’s income statements over time reveals
opportunities as well as constraints. Suppose you would like to
get permission to hire one or two more people.Слайд 58Managing a P&L
Many managers have P&L responsibility, which means they
are accountable for an entire chunk of the income statement.
This is probably the case if you’re running a business unit, a store, a plant, or a branch office, or if you’re overseeing a product line. The income statement you are accountable for isn’t quite the same as the whole company’s. For instance, it is unlikely to include interest expense and other overhead items, except as an “allocation” at the end of the year.Слайд 60The Cash Flow Statement
The cash flow statement is the least used—and least
understood—of the three essential statements. It shows in broad categories
how a company acquired and spent its cash during a given span of time. As you’d expect, expenditures show up on the statement as negative figures, and sources of income figures are positive. The bottom line in each category is simply the net total of inflows and out- flows, and it can be either positive or negative.Слайд 61The statement has three major categories:
Operating activities, or operations, refers to cash generated
by, and used in, a company’s ordinary business operations. It
includes everything that doesn’t explicitly fall into the other two categories.Investing activities covers cash spent on capital equipment and other investments (outgoing), and cash realized from the sale of such investments (incoming).
Financing activities refers to cash used to reduce debt, buy back stock, or pay dividends (outgoing), and cash from loans or from stock sales (incoming).
