Разделы презентаций
- Разное
- Английский язык
- Астрономия
- Алгебра
- Биология
- География
- Геометрия
- Детские презентации
- Информатика
- История
- Литература
- Математика
- Медицина
- Менеджмент
- Музыка
- МХК
- Немецкий язык
- ОБЖ
- Обществознание
- Окружающий мир
- Педагогика
- Русский язык
- Технология
- Физика
- Философия
- Химия
- Шаблоны, картинки для презентаций
- Экология
- Экономика
- Юриспруденция
IBM Software Group ® Essentials of Visual Modeling with UML 2.0 Module 7:
Содержание
- 1. IBM Software Group ® Essentials of Visual Modeling with UML 2.0 Module 7:
- 2. ЦелиПоказать, как читаются и интерпретируются диаграммы:Диаграмма конечных автоматовДиаграмма компонентов Диаграмма развертывания
- 3. Где мы сейчас?State machine diagramsComponent diagrams Deployment diagrams
- 4. Обзор: Объект имеет определенные состоянияСостояние это ситуация
- 5. Пример: ПреподавательПеред тем, как стать Профессором, человек
- 6. Что такое Диаграмма конечных автоматов?A state machine
- 7. Special StatesThe initial state is the state
- 8. What Are Events?An event is the specification
- 9. What Are Transitions?A transition is a change
- 10. Example: State MachineHiredTenuredrejectedacceptedtakeSabbaticalretiredmaxPapersseniorityreturn
- 11. Where Are We?State machine diagramsComponent diagrams Deployment diagrams
- 12. What Is a Component Diagram?A diagram that shows the organizations and dependencies among components
- 13. What Is a Component?A modular part of
- 14. Where Are We?State machine diagramsComponent diagrams Deployment diagrams
- 15. What Is a Deployment Diagram?The deployment diagram
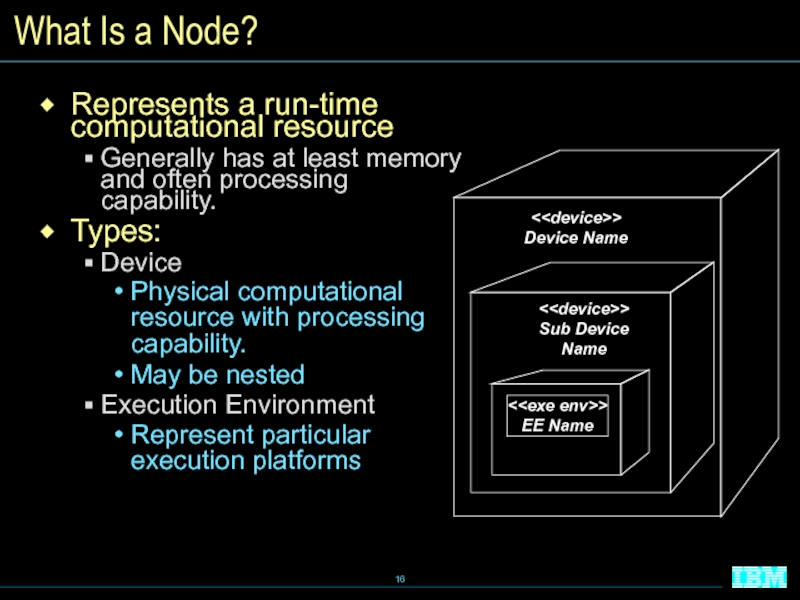
- 16. What Is a Node?Represents a run-time computational
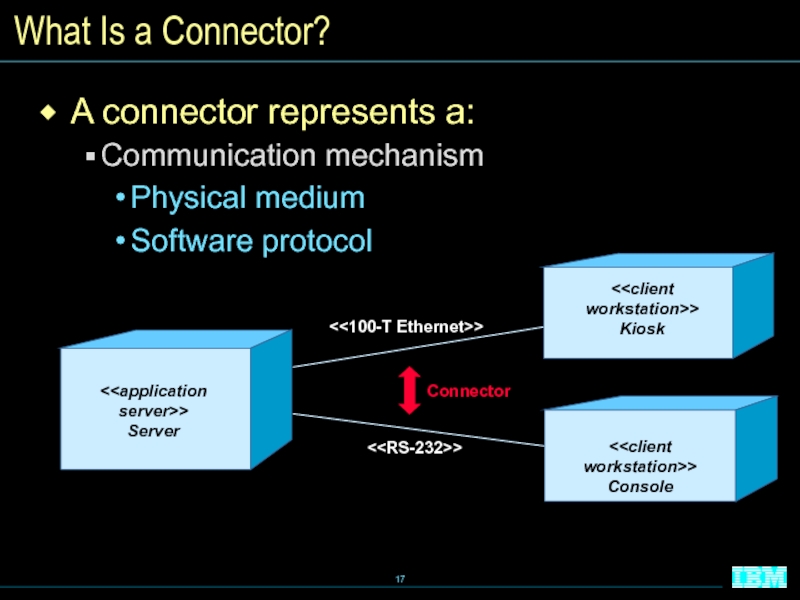
- 17. What Is a Connector?A connector represents a:Communication mechanismPhysical mediumSoftware protocolServerConnectorConsoleKiosk
- 18. Example: Deployment DiagramCourse CatalogRegistration ServerBilling System0..200011111
- 19. Example: Deployment Diagram with ProcessesCourse CatalogRegistration ServerPCBilling SystemCourseCatalogSystemAccessCourseRegistrationProcessBillingSstemAccessStudentApplication0..200011111
- 20. Define state. How do you determine the
- 21. Скачать презентанцию
Слайды и текст этой презентации
Слайд 2Цели
Показать, как читаются и интерпретируются диаграммы:
Диаграмма конечных автоматов
Диаграмма компонентов
Диаграмма
развертывания
Слайд 4Обзор: Объект имеет определенные состояния
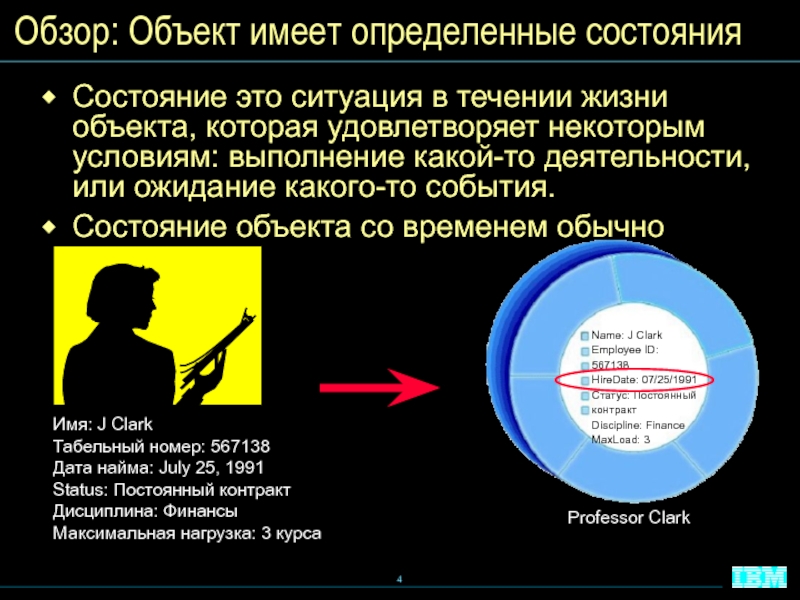
Состояние это ситуация в течении жизни
объекта, которая удовлетворяет некоторым условиям: выполнение какой-то деятельности, или ожидание
какого-то события.Состояние объекта со временем обычно изменяется.
Имя: J Clark
Табельный номер: 567138
Дата найма: July 25, 1991
Status: Постоянный контракт
Дисциплина: Финансы
Максимальная нагрузка: 3 курса
Name: J Clark
Employee ID: 567138
HireDate: 07/25/1991
Статус: Постоянный контракт
Discipline: Finance
MaxLoad: 3
Professor Clark
Слайд 5Пример: Преподаватель
Перед тем, как стать Профессором, человек происходит через следующие
состояния.
Assistant professor (achieves tenure by producing a number of
quality publications)Tenure/Associate professor
Professor (based on seniority)
Слайд 6Что такое Диаграмма конечных автоматов?
A state machine diagram models dynamic
behavior.
It specifies the sequence of states in which an object
can exist:The events and conditions that cause the object to reach those states
The actions that take place when those states are reached
Assistant
Professor
Tenured
Слайд 7Special States
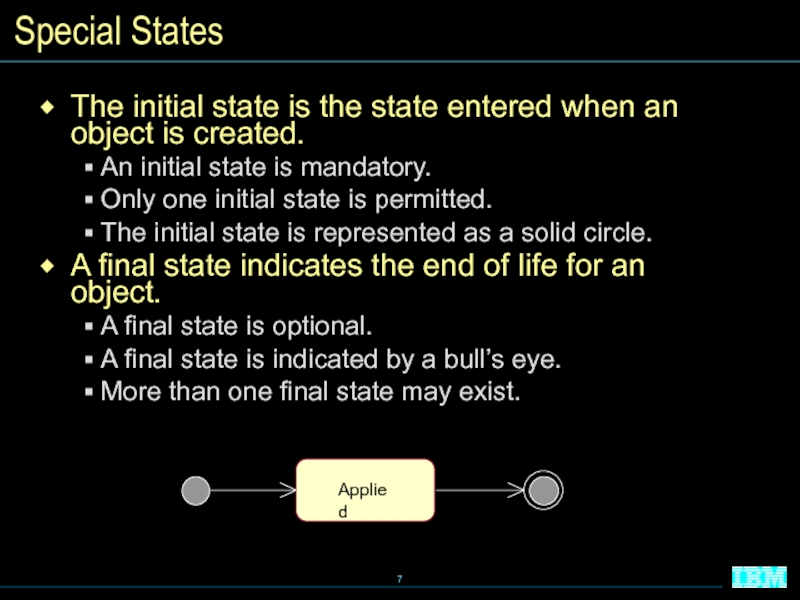
The initial state is the state entered when an
object is created.
An initial state is mandatory.
Only one initial state
is permitted.The initial state is represented as a solid circle.
A final state indicates the end of life for an object.
A final state is optional.
A final state is indicated by a bull’s eye.
More than one final state may exist.
Applied
Слайд 8What Are Events?
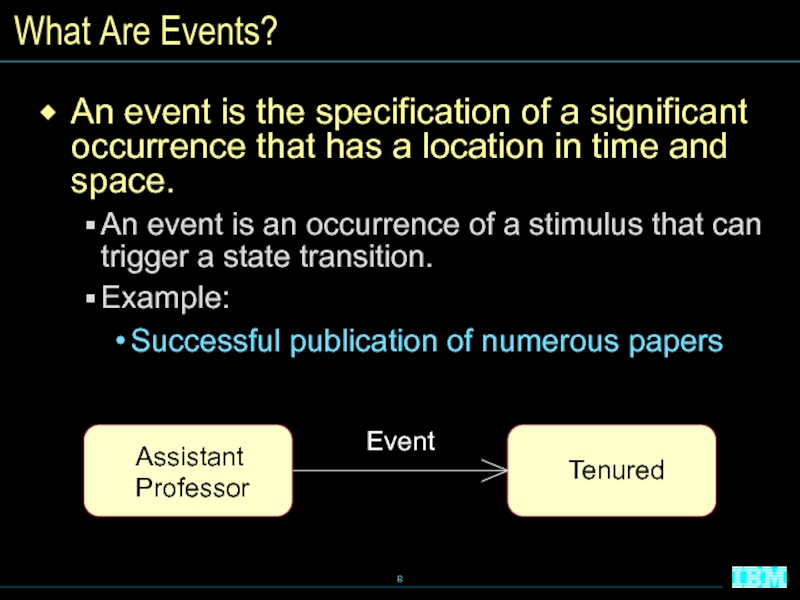
An event is the specification of a significant
occurrence that has a location in time and space.
An event
is an occurrence of a stimulus that can trigger a state transition.Example:
Successful publication of numerous papers
Tenured
Assistant
Professor
Event
Слайд 9What Are Transitions?
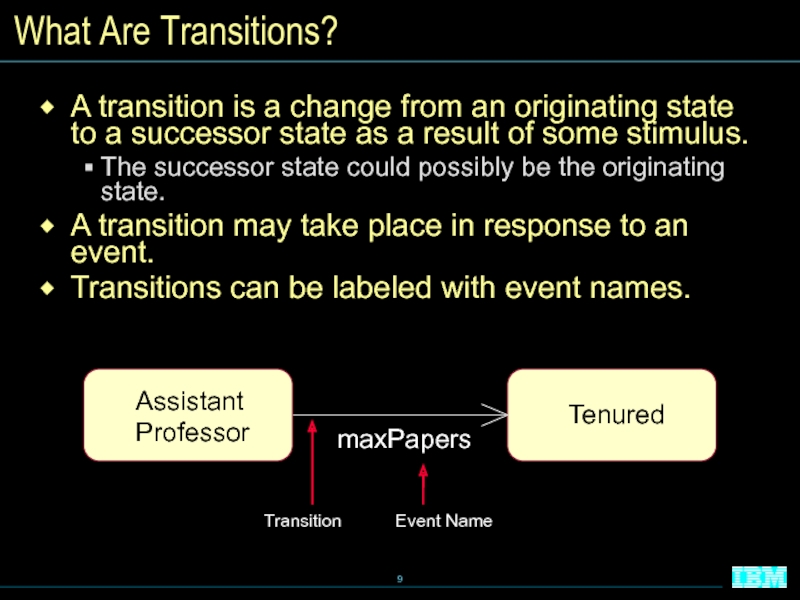
A transition is a change from an originating
state to a successor state as a result of some
stimulus.The successor state could possibly be the originating state.
A transition may take place in response to an event.
Transitions can be labeled with event names.
Transition
Event Name
Tenured
Assistant
Professor
maxPapers
Слайд 10Example: State Machine
Hired
Tenured
rejected
accepted
takeSabbatical
retired
maxPapers
seniority
return
Слайд 12What Is a Component Diagram?
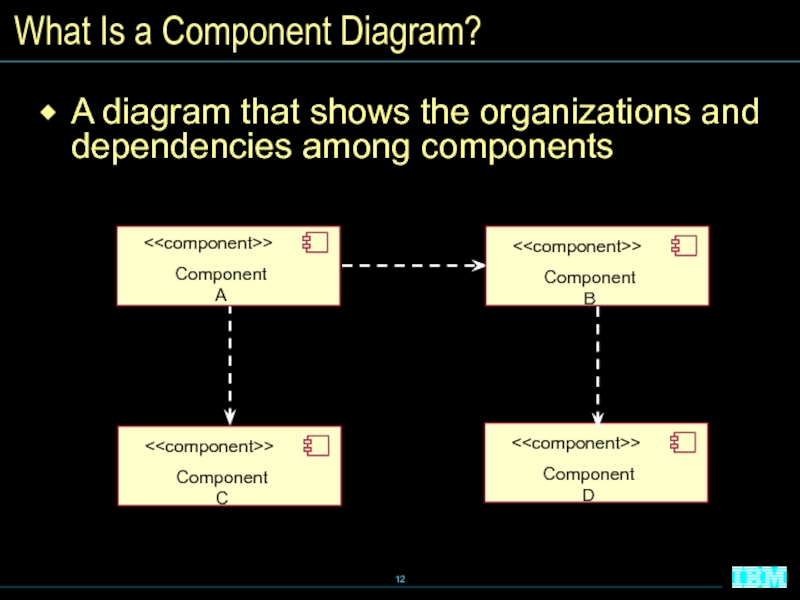
A diagram that shows the organizations
and dependencies among components
Слайд 13What Is a Component?
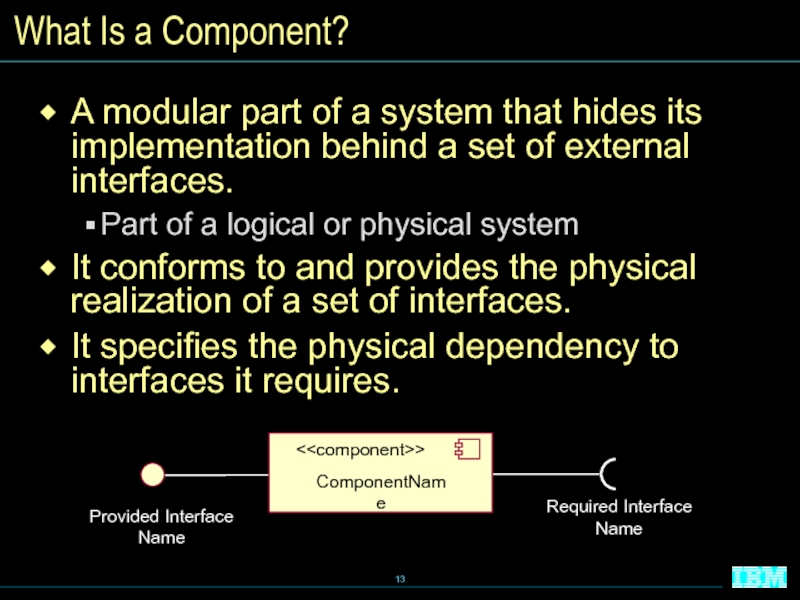
A modular part of a system that
hides its implementation behind a set of external interfaces.
Part of
a logical or physical systemIt conforms to and provides the physical realization of a set of interfaces.
It specifies the physical dependency to interfaces it requires.
Provided Interface
Name
Required Interface
Name
Слайд 15What Is a Deployment Diagram?
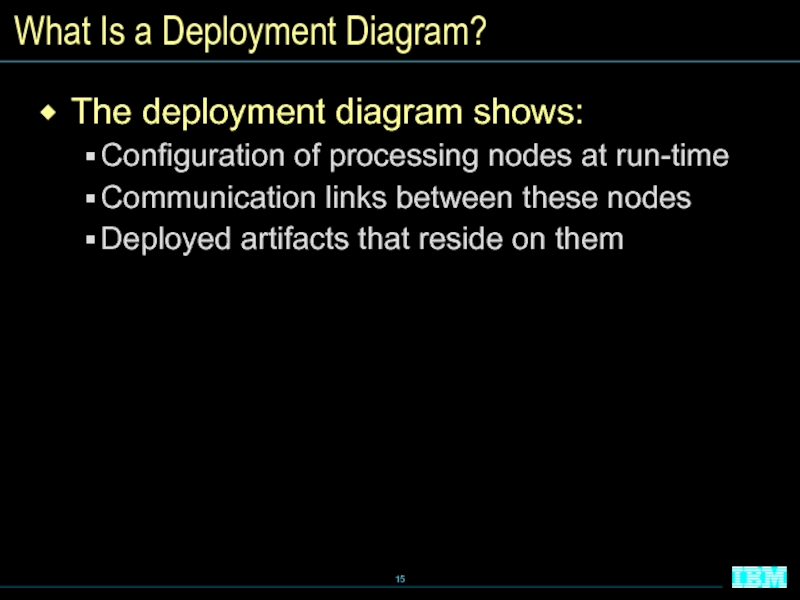
The deployment diagram shows:
Configuration of processing
nodes at run-time
Communication links between these nodes
Deployed artifacts that reside
on themСлайд 16What Is a Node?
Represents a run-time computational resource
Generally has at
least memory and often processing capability.
Types:
Device
Physical computational resource with processing
capability.May be nested
Execution Environment
Represent particular execution platforms
< < <
EE Name
Device Name
Sub Device
Name
Слайд 17What Is a Connector?
A connector represents a:
Communication mechanism
Physical medium
Software protocol
server>>
Server
Connector
Console
Kiosk
Слайд 19Example: Deployment Diagram with Processes
Course Catalog
server>>
Registration Server
PC
Billing
System
CourseCatalogSystemAccess
CourseRegistrationProcess
BillingSstemAccess
StudentApplication
0..2000
1
1
1
1
1
Слайд 20Define state. How do you determine the classes with significant
state?
What is a state machine diagram? Describe the different parts
of the diagram.What is a component diagram?
What is the purpose of a deployment diagram?
Review

