Разделы презентаций
- Разное
- Английский язык
- Астрономия
- Алгебра
- Биология
- География
- Геометрия
- Детские презентации
- Информатика
- История
- Литература
- Математика
- Медицина
- Менеджмент
- Музыка
- МХК
- Немецкий язык
- ОБЖ
- Обществознание
- Окружающий мир
- Педагогика
- Русский язык
- Технология
- Физика
- Философия
- Химия
- Шаблоны, картинки для презентаций
- Экология
- Экономика
- Юриспруденция
Presentation Title 1. 2 Lines at the most
Содержание
- 1. Presentation Title 1. 2 Lines at the most
- 2. Presentation Title 2. 2 Lines, 4 light colored Pictures.Subtitle, introduction of the speaker et cetera.
- 3. Presentation Title 2. 2 Lines, 4 light
- 4. Presentation Title 3. 2 Lines, 4 dark colored Pictures.Subtitle, introduction of the speaker et cetera.
- 5. Presentation Title 3. 2 Lines, 4 dark
- 6. Subtitle, introduction of the speaker et
- 7. Presentation Title 4. 2 Lines at the
- 8. Presentation Title 5. 2 Lines at the
- 9. Picture 1Presentation Title 5. 2 Lines at
- 10. Text Chart.Basic text runs left-aligned and
- 11. Text Chart. Sub headline. Basic text
- 12. Bullets. Levels of Information.The automatic list of
- 13. Text Chart, 1 Picture. Sub headline.Basic
- 14. Picture 1Text Chart, 1 Picture. Sub
- 15. Text Chart, 2 Pictures. Sub headline.Basic
- 16. Picture 1Picture 2Text Chart, 2 Pictures.
- 17. Text Chart. 1 Key visual +
- 18. Text Chart. 1 Key visual +
- 19. Chapter Divider. Text in 3 or 4 Lines at the most. Text color red.
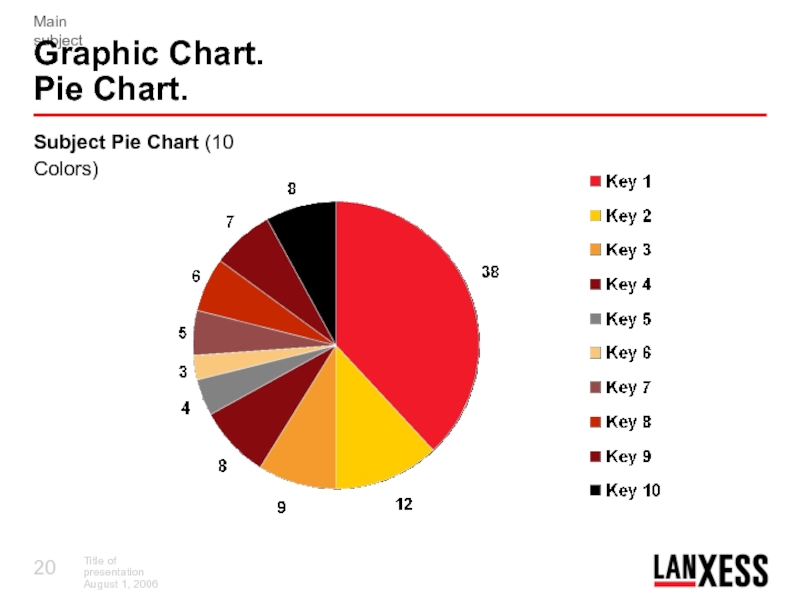
- 20. Subject Pie Chart (10 Colors)Graphic Chart. Pie Chart.
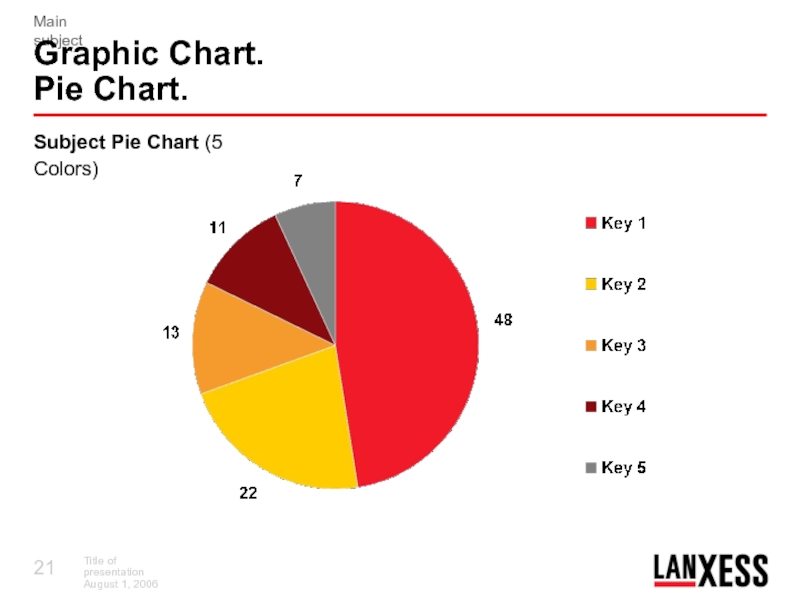
- 21. Subject Pie Chart (5 Colors)Graphic Chart. Pie Chart.
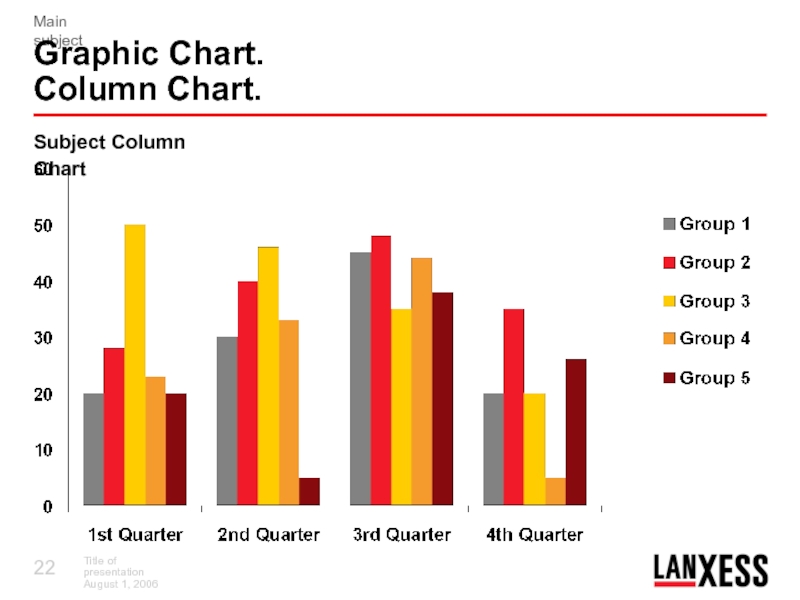
- 22. Graphic Chart. Column Chart.Subject Column Chart
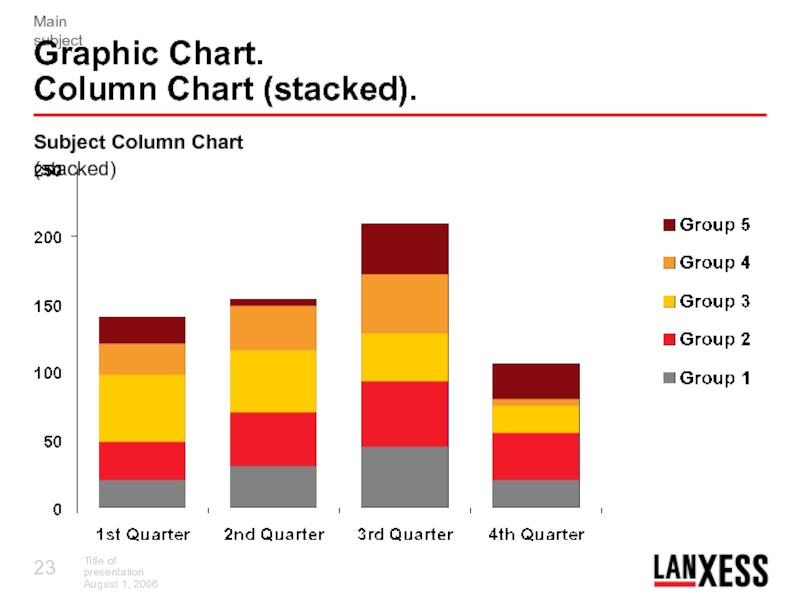
- 23. Graphic Chart. Column Chart (stacked).Subject Column Chart (stacked)
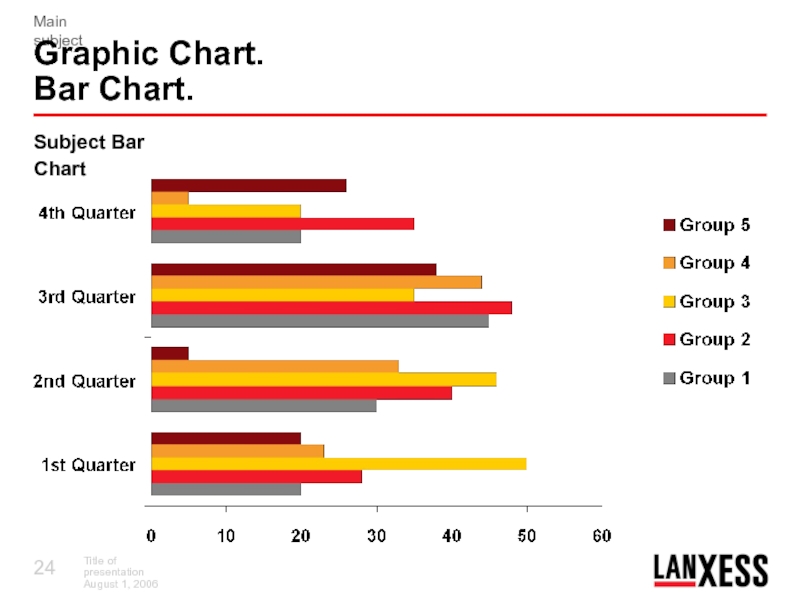
- 24. Graphic Chart. Bar Chart.Subject Bar Chart
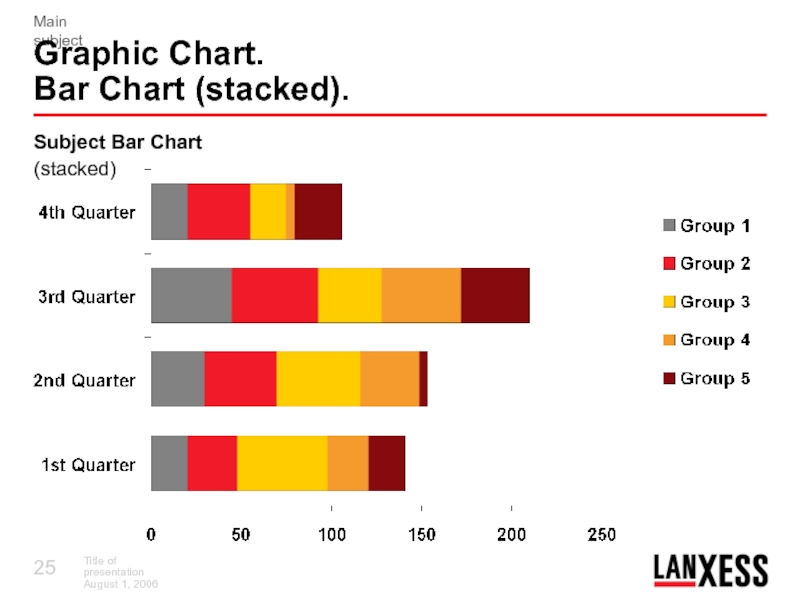
- 25. Graphic Chart. Bar Chart (stacked).Subject Bar Chart (stacked)
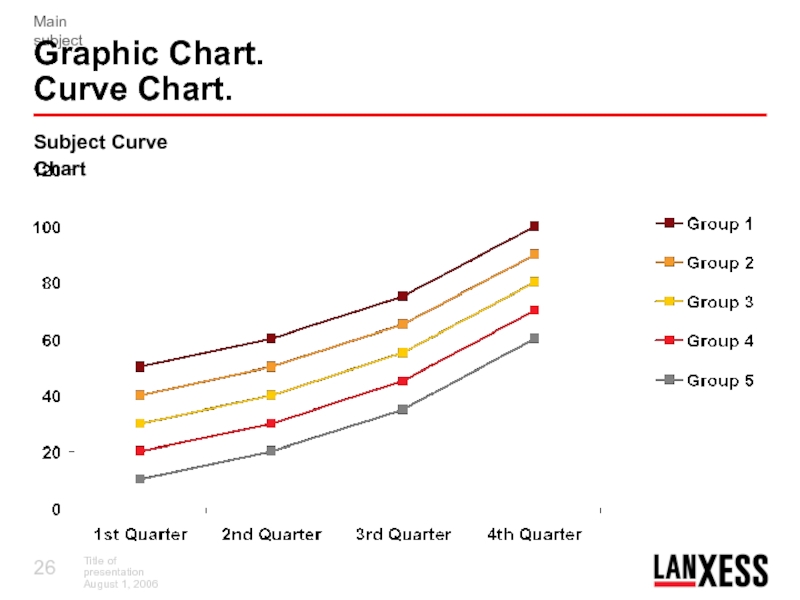
- 26. Graphic Chart. Curve Chart.Subject Curve Chart
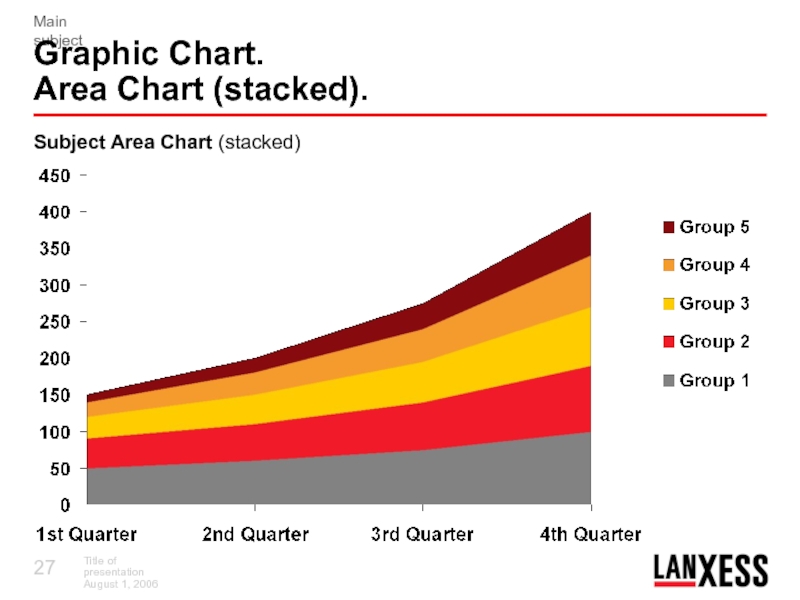
- 27. Graphic Chart. Area Chart (stacked).Subject Area Chart (stacked)
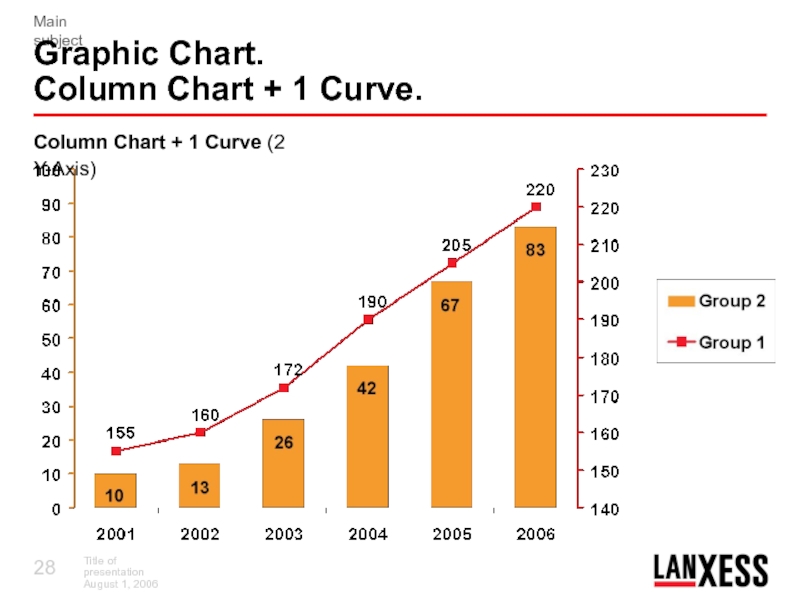
- 28. Graphic Chart. Column Chart + 1 Curve.Column Chart + 1 Curve (2 Y-Axis)
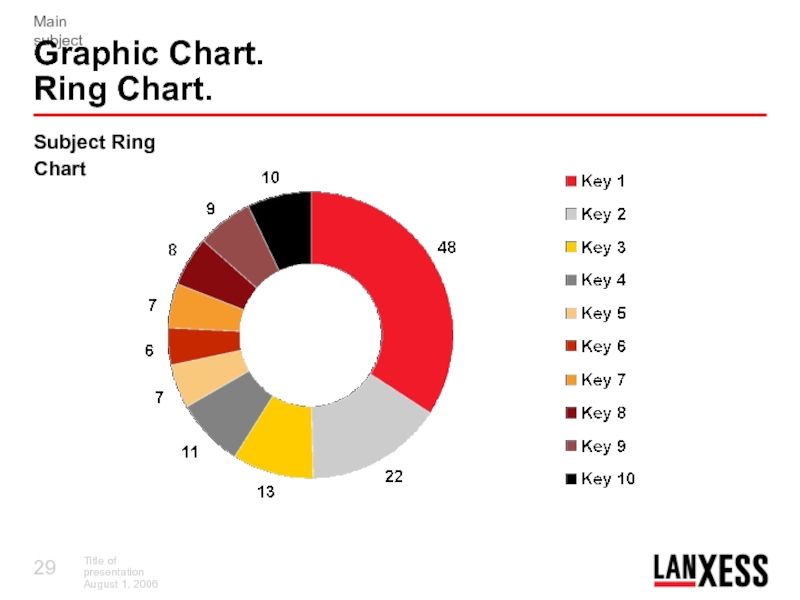
- 29. Subject Ring ChartGraphic Chart. Ring Chart.
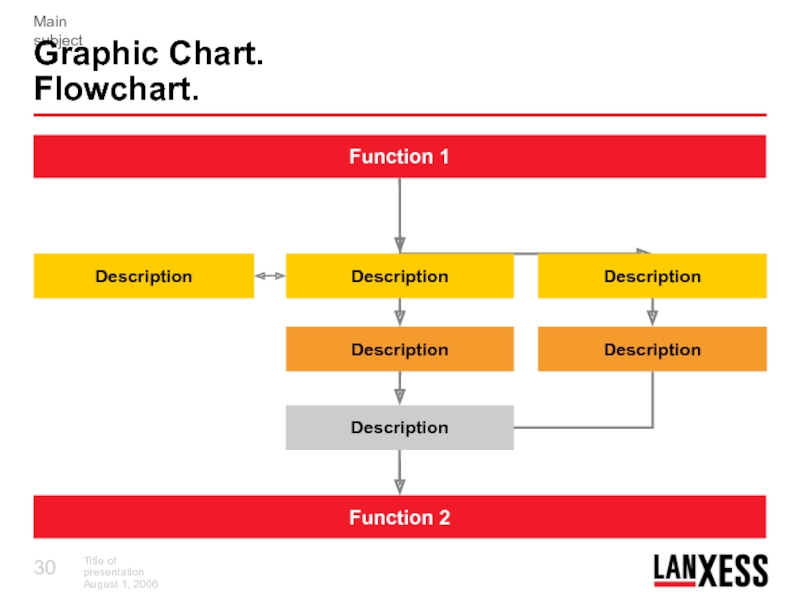
- 30. Graphic Chart. Flowchart.DescriptionDescriptionDescriptionDescriptionDescriptionDescriptionFunction 2Function 1
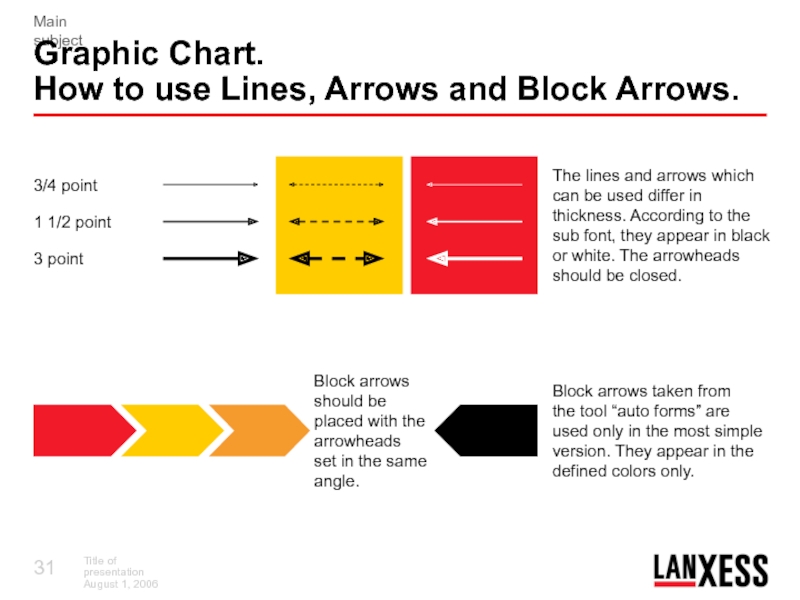
- 31. Graphic Chart. How to use Lines, Arrows
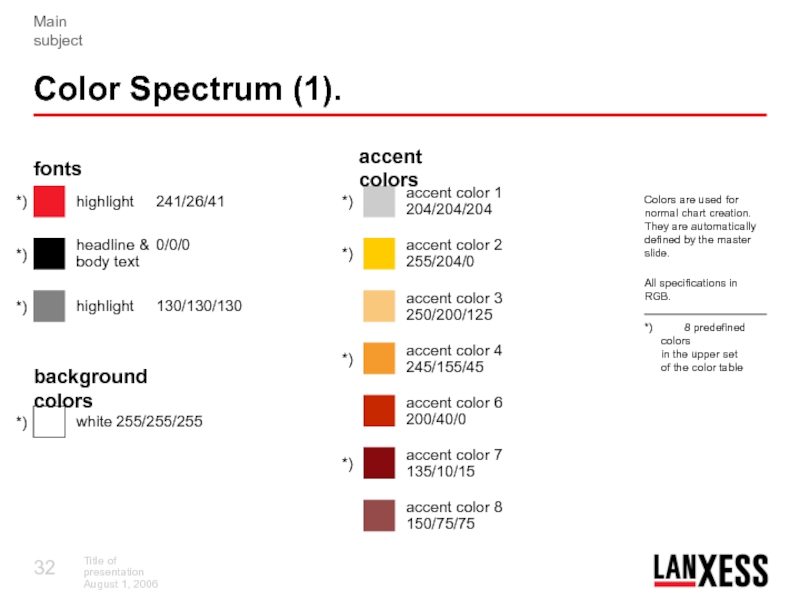
- 32. fontsColor Spectrum (1).*)*)*)background colors*)*)*)*)*)accent color 1 204/204/204accent color
- 33. Predefined colors for areas, lines and textLANXESS
- 34. Layout Grid. To align Text, Pictures, et
- 35. Thank You for Your Attention
- 36. Слайд 36
- 37. Скачать презентанцию
Слайды и текст этой презентации
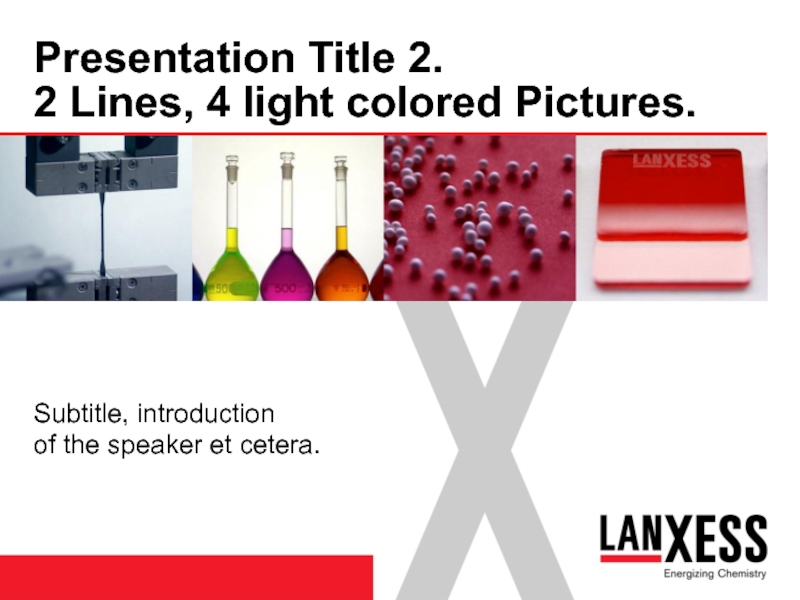
Слайд 2Presentation Title 2.
2 Lines, 4 light colored Pictures.
Subtitle, introduction
of
the speaker et cetera.
Слайд 3Presentation Title 2.
2 Lines, 4 light colored Pictures.
Picture 1
Picture 2
Picture
3
Picture 4
Subtitle, introduction
of the speaker et cetera.
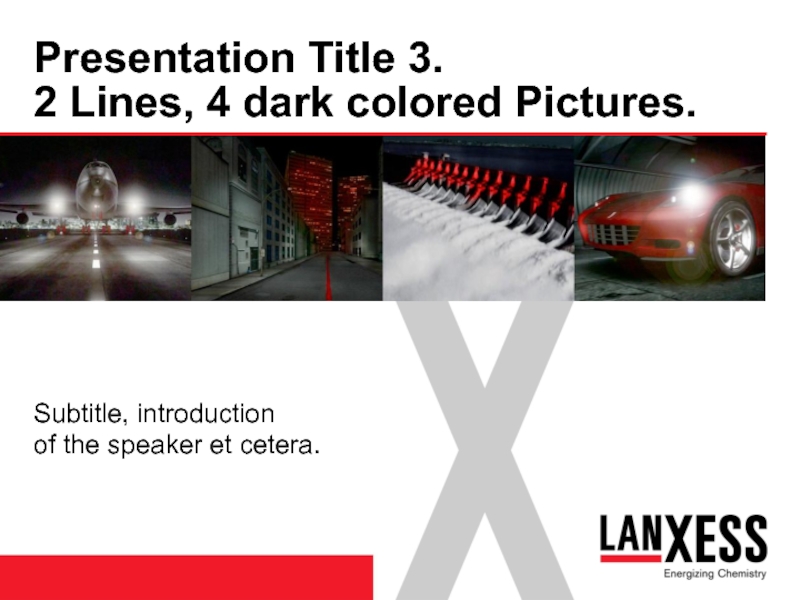
Слайд 4Presentation Title 3.
2 Lines, 4 dark colored Pictures.
Subtitle, introduction
of
the speaker et cetera.
Слайд 5Presentation Title 3.
2 Lines, 4 dark colored Pictures.
Picture 1
Picture 2
Picture
3
Picture 4
Subtitle, introduction
of the speaker et cetera.
Слайд 6Subtitle, introduction
of the speaker et cetera.
Presentation Title 4.
2 Lines
at the most, 1 Picture.
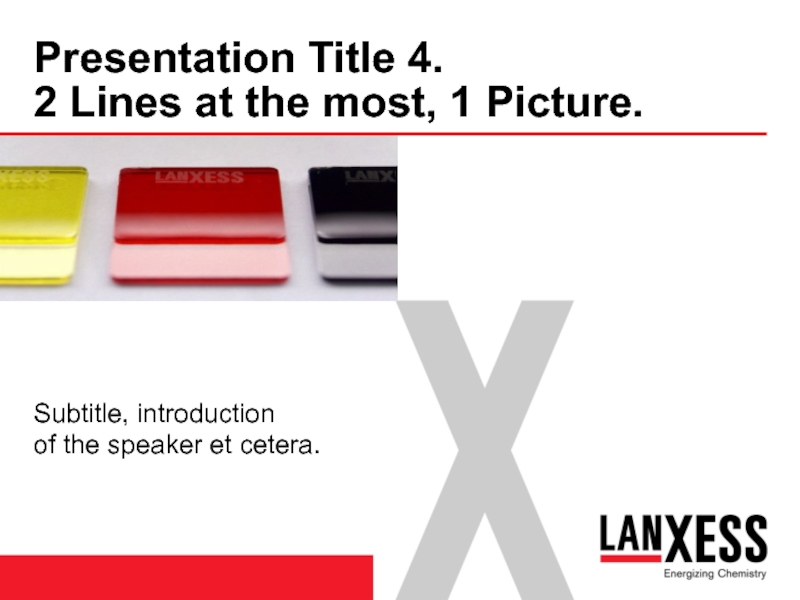
Слайд 7Presentation Title 4.
2 Lines at the most, 1 Picture.
Picture 1
Subtitle,
introduction
of the speaker et cetera.
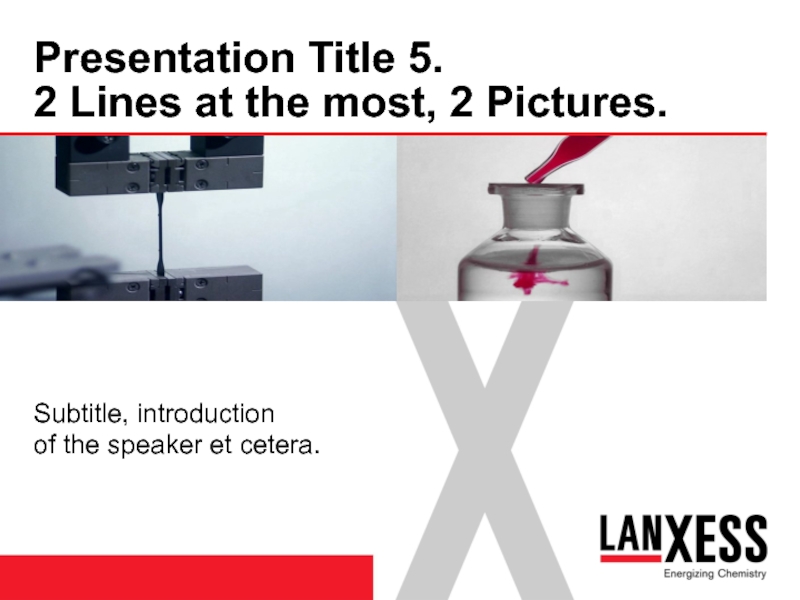
Слайд 8Presentation Title 5.
2 Lines at the most, 2 Pictures.
Subtitle, introduction
of the speaker et cetera.
Слайд 9Picture 1
Presentation Title 5.
2 Lines at the most, 2 Pictures.
Picture
2
Subtitle, introduction
of the speaker et cetera.
Слайд 10
Text Chart.
Basic text runs left-aligned and without indentions. It can
span one or several lines. Line length and the font
size 18 pt has been developed due to optimal legibility.The space between two paragraphs is 1.5 lines and will appear automatically as soon you press the key for “enter”.
Слайд 11Text Chart.
Sub headline.
Basic text runs left-aligned and without
indentions. It can span one or several lines. Line length
and the font size 18 pt has been developed due to optimal legibility.The space between two paragraphs is 1.5 lines and will appear automatically as soon you press the key for “enter”.
Important terms can be highlighted in Arial bold and/or colored in red.
Слайд 12Bullets.
Levels of Information.
The automatic list of bullets is created by
activating the organizational levels. Basic text is situated in the first
organizational level (18 pt).In the second organizational level listed text appears automatically indented and with bullets in 18 pt.
In the third organizational level listed text appears automatically indented and with bullets in 18 pt.
In the fourth organizational level listed text appears a little smaller and automatically with bullets in 16 pt.
In the fifth organizational level text appears only indented.
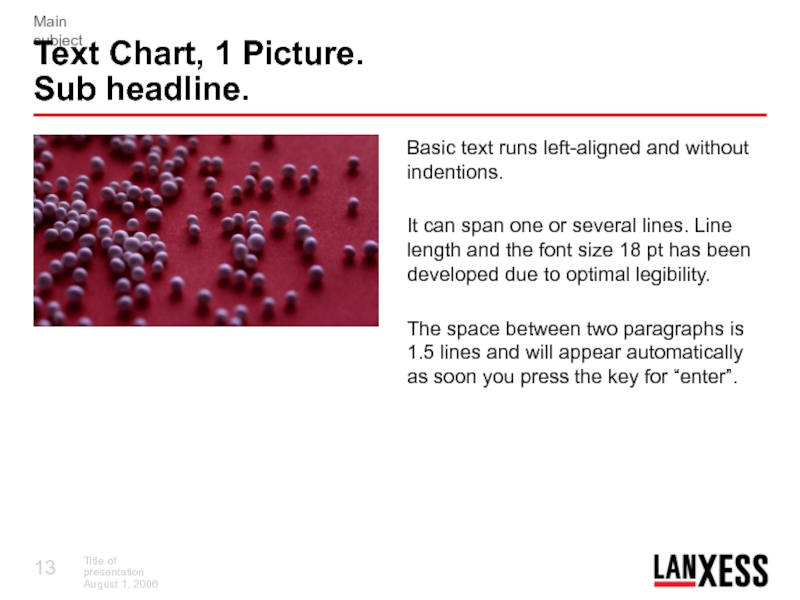
Слайд 13Text Chart, 1 Picture.
Sub headline.
Basic text runs left-aligned and
without indentions.
It can span one or several lines. Line
length and the font size 18 pt has been developed due to optimal legibility.The space between two paragraphs is 1.5 lines and will appear automatically as soon you press the key for “enter”.
Слайд 14Picture 1
Text Chart, 1 Picture.
Sub headline.
Basic text runs left-aligned
and without indentions.
It can span one or several lines.
Line length and the font size 18 pt has been developed due to optimal legibility.The space between two paragraphs is 1.5 lines and will appear automatically as soon you press the key for “enter”.
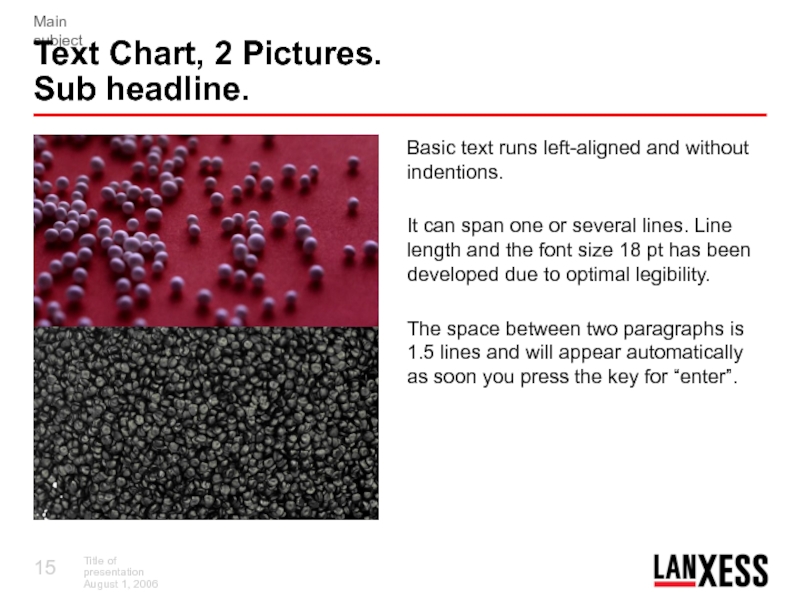
Слайд 15Text Chart, 2 Pictures.
Sub headline.
Basic text runs left-aligned and
without indentions.
It can span one or several lines. Line
length and the font size 18 pt has been developed due to optimal legibility.The space between two paragraphs is 1.5 lines and will appear automatically as soon you press the key for “enter”.
Слайд 16Picture 1
Picture 2
Text Chart, 2 Pictures.
Sub headline.
Basic text runs
left-aligned and without indentions.
It can span one or several
lines. Line length and the font size 18 pt has been developed due to optimal legibility.The space between two paragraphs is 1.5 lines and will appear automatically as soon you press the key for “enter”.
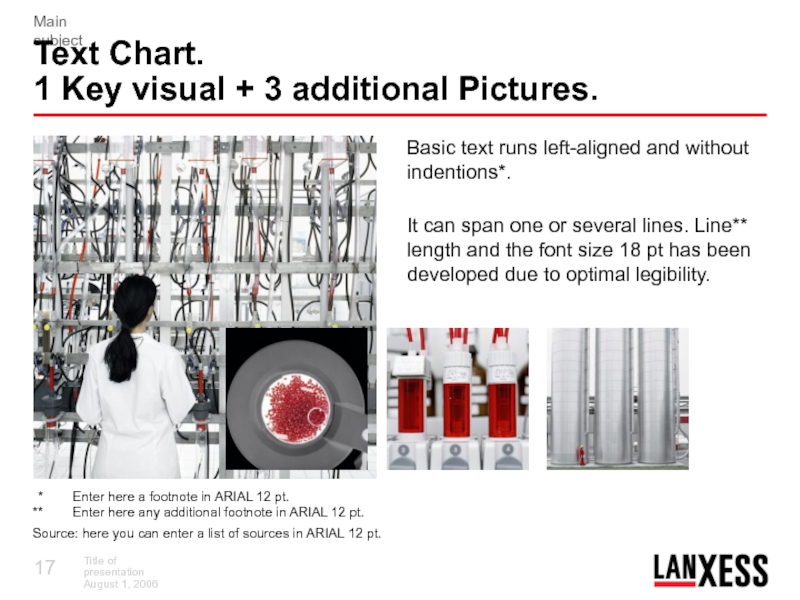
Слайд 17Text Chart.
1 Key visual + 3 additional Pictures.
* Enter
here a footnote in ARIAL 12 pt. ** Enter here any additional
footnote in ARIAL 12 pt.Source: here you can enter a list of sources in ARIAL 12 pt.
Basic text runs left-aligned and without indentions*.
It can span one or several lines. Line** length and the font size 18 pt has been developed due to optimal legibility.
Слайд 18Text Chart.
1 Key visual + 3 additional Pictures.
* Enter
here a footnote in ARIAL 12 pt. ** Enter here any additional
footnote in ARIAL 12 pt.Source: here you can enter a list of sources in ARIAL 12 pt.
Basic text runs left-aligned and without indentions*.
It can span one or several lines. Line** length and the font size 18 pt has been developed due to optimal legibility.
Bild 1
Bild 2
Bild 3
Bild 4
Слайд 30Graphic Chart.
Flowchart.
Description
Description
Description
Description
Description
Description
Function 2
Function 1
Слайд 31Graphic Chart.
How to use Lines, Arrows and Block Arrows.
The lines
and arrows which can be used differ in thickness. According
to the sub font, they appear in black or white. The arrowheads should be closed.Block arrows
should be
placed with the
arrowheads
set in the same
angle.
3/4 point
1 1/2 point
3 point
Block arrows taken from
the tool “auto forms” are
used only in the most simple
version. They appear in the
defined colors only.
Слайд 32fonts
Color Spectrum (1).
*)
*)
*)
background colors
*)
*)
*)
*)
*)
accent color 1 204/204/204
accent color 2 255/204/0
accent color 3
250/200/125
accent color 4 245/155/45
accent color 6 200/40/0
accent color 7 135/10/15
accent
color 8 150/75/75Colors are used for
normal chart creation.
They are automatically
defined by the master
slide.
All specifications in RGB.
*) 8 predefined colors
in the upper set
of the color table
highlight 241/26/41
headline & 0/0/0
body text
highlight 130/130/130
white 255/255/255
accent colors
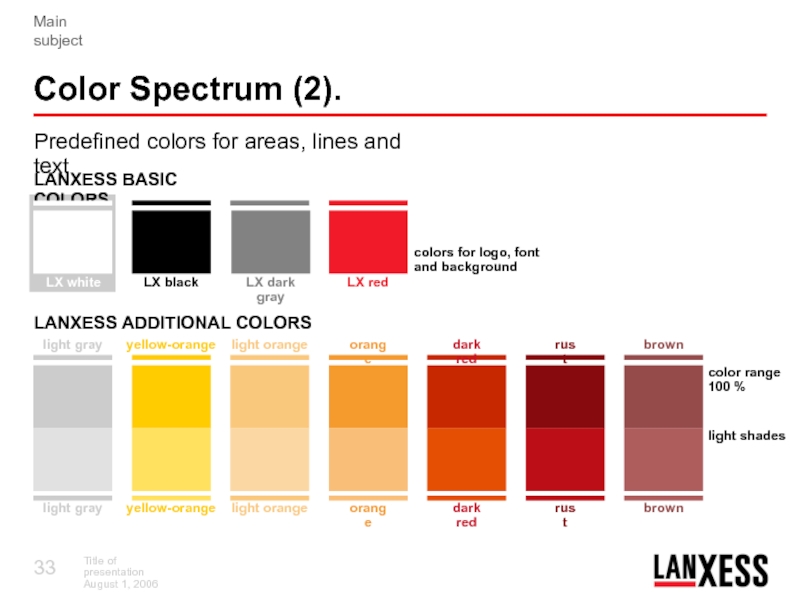
Слайд 33Predefined colors for areas, lines and text
LANXESS BASIC COLORS
LANXESS ADDITIONAL
COLORS
LX white
Color Spectrum (2).
light gray
LX red
orange
dark red
rust
LX dark gray
light orange
LX
blackyellow-orange
brown
light gray
orange
dark red
rust
light orange
yellow-orange
brown
colors for logo, font
and background
color range
100 %
light shades
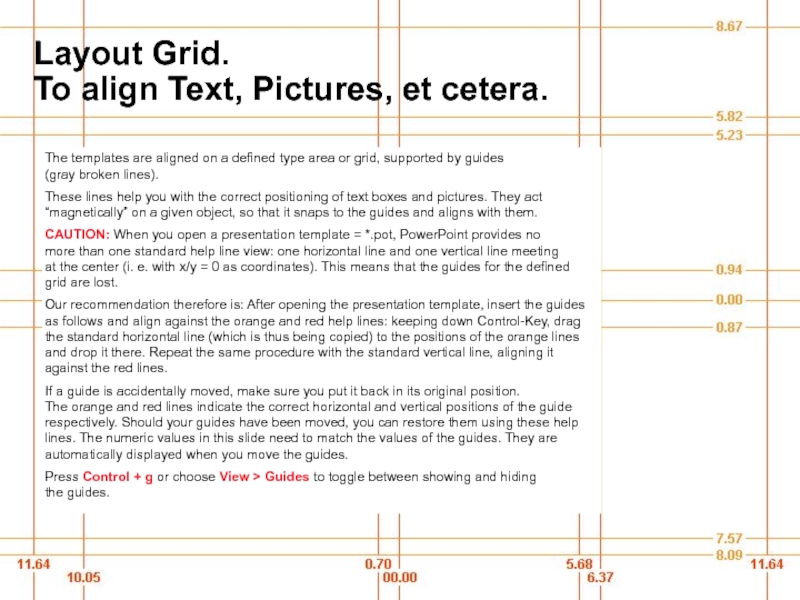
Слайд 34Layout Grid.
To align Text, Pictures, et cetera.
The templates are aligned
on a defined type area or grid, supported by guides
(gray broken lines).These lines help you with the correct positioning of text boxes and pictures. They act “magnetically” on a given object, so that it snaps to the guides and aligns with them.
CAUTION: When you open a presentation template = *.pot, PowerPoint provides no more than one standard help line view: one horizontal line and one vertical line meeting at the center (i. e. with x/y = 0 as coordinates). This means that the guides for the defined grid are lost.
Our recommendation therefore is: After opening the presentation template, insert the guides as follows and align against the orange and red help lines: keeping down Control-Key, drag the standard horizontal line (which is thus being copied) to the positions of the orange lines and drop it there. Repeat the same procedure with the standard vertical line, aligning it against the red lines.
If a guide is accidentally moved, make sure you put it back in its original position. The orange and red lines indicate the correct horizontal and vertical positions of the guide respectively. Should your guides have been moved, you can restore them using these help lines. The numeric values in this slide need to match the values of the guides. They are automatically displayed when you move the guides.
Press Control + g or choose View > Guides to toggle between showing and hiding the guides.
