Разделы презентаций
- Разное
- Английский язык
- Астрономия
- Алгебра
- Биология
- География
- Геометрия
- Детские презентации
- Информатика
- История
- Литература
- Математика
- Медицина
- Менеджмент
- Музыка
- МХК
- Немецкий язык
- ОБЖ
- Обществознание
- Окружающий мир
- Педагогика
- Русский язык
- Технология
- Физика
- Философия
- Химия
- Шаблоны, картинки для презентаций
- Экология
- Экономика
- Юриспруденция
Seminar 2 Introduction to modern portfolio theory: the set up
Содержание
- 1. Seminar 2 Introduction to modern portfolio theory: the set up
- 2. Слайд 2
- 3. Recent view on quantitative methods in decision-makingQuantitative
- 4. Most successful hedge funds (as of 2017)Renaissance
- 5. Role of data analysis in modern finance
- 6. Big data in actionParking lots trafficIn 2015
- 7. Course objectiveLook at one particular application of
- 8. General workflow in the asset management industryUnderstand
- 9. Your projectsHow did you pick assets?How did
- 10. Your projectsHow did you pick assets?How did
- 11. Key portfolio characteristicsReturnRiskComplex measures of the probability
- 12. Risk vs returnThe risk and return trade-off
- 13. Daily data
- 14. Flash Crash 2010 (intraday data)Almost 10% drop
- 15. Risk vs returnThe risk and return trade-off
- 16. Portfolio theory: outlineNaïve 1/nMarkowitz theoryRisk parity theoryHierarchical risk parity
- 17. DiversificationObjective: lower our exposure to riskIf assets
- 18. DiversificationObjective: lower our exposure to riskIf assets
- 19. Decision-making processWhat is rational decision-making?Imagine playing a
- 20. Decision-making processIf everybody is rational, then you
- 21. Individual preferences
- 22. Attitude to risk
- 23. Attitude to risk
- 24. Attitude to risk
- 25. ConclusionsData analysis is a core element of
- 26. Thank you!
- 27. Скачать презентанцию
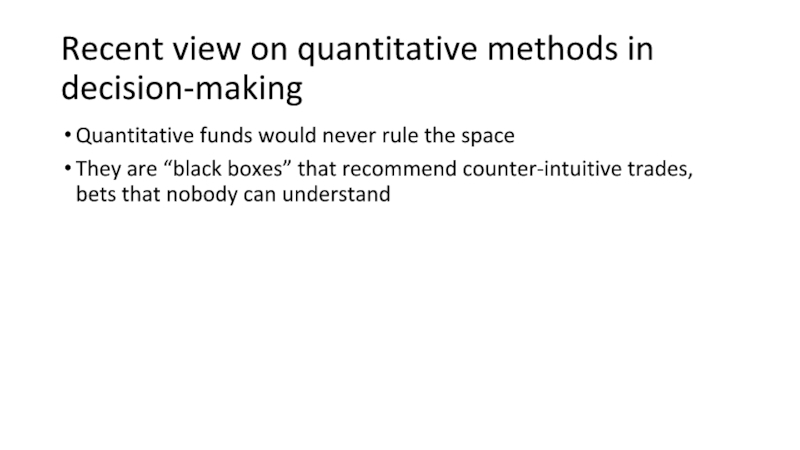
Recent view on quantitative methods in decision-makingQuantitative funds would never rule the spaceThey are “black boxes” that recommend counter-intuitive trades, bets that nobody can understand
Слайды и текст этой презентации
Слайд 1Seminar 2
Introduction to modern portfolio theory: the set up
Mikhail Kamrotov
Data
Analysis in Economics and Finance
Слайд 3Recent view on quantitative methods in decision-making
Quantitative funds would never
rule the space
They are “black boxes” that recommend counter-intuitive trades,
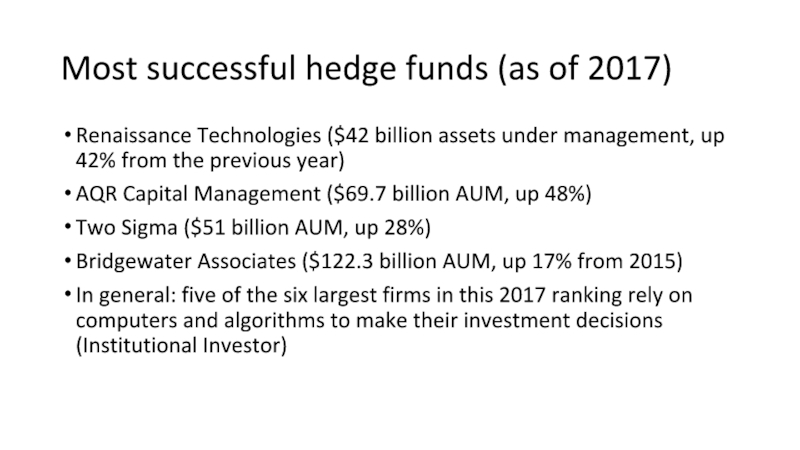
bets that nobody can understandСлайд 4Most successful hedge funds (as of 2017)
Renaissance Technologies ($42 billion
assets under management, up 42% from the previous year)
AQR Capital
Management ($69.7 billion AUM, up 48%)Two Sigma ($51 billion AUM, up 28%)
Bridgewater Associates ($122.3 billion AUM, up 17% from 2015)
In general: five of the six largest firms in this 2017 ranking rely on computers and algorithms to make their investment decisions (Institutional Investor)
Слайд 5Role of data analysis in modern finance
Investment shops are
fighting over mathematicians and engineers
FinTech
“Half of the books about finance
are written by authors who have not practiced what they teach. They contain extremely elegant mathematics that describe a world that does not exist. The other half of the books are written by authors who offer explanations absent of any academic theory. They misuse mathematical tools to describe actual observations”. (Lopez de Prado)Data analysis fills the gap between theory and practice
Слайд 6Big data in action
Parking lots traffic
In 2015 certain hedge funds
utilizing satellite data sources noted rising traffic in the parking lots
of J.C. Penny storesThis was a clear sign of increasing sales
JCP’s stock jumped more than 10% when public reports of JCP’s increased store traffic came to light in August.
Crop estimates
In 2015 some investment firms examined infrared satellite images taken of over one million corn fields
They correctly predicted that U.S. corn production was 2.8% smaller than prevailing government estimates
Successful market guessing requires data analysis skills!
Слайд 7Course objective
Look at one particular application of data analysis
Make it
as close to practice as possible
Avoid the misuse of mathematics
Ultimate
goal: build an investment portfolioDiscuss modern approaches
Gather financial data
Compute optimal asset allocations
Evaluate historical performance
Track out-of-sample results
Слайд 8General workflow in the asset management industry
Understand client (or your
own) needs
Formalize requirements
Build an algorithm that produces tailored portfolio
Слайд 9Your projects
How did you pick assets?
How did you match characteristics
of your portfolio to client profiles?
How did you assign weights?
What
measures did you use for selecting the best portfolio?Слайд 10Your projects
How did you pick assets?
How did you match characteristics
of your portfolio to client profiles?
How did you assign weights?
What
measures did you use for selecting the best portfolio?How well have your portfolios performed since inception?
Let’s go to investing.com and check
Слайд 11Key portfolio characteristics
Return
Risk
Complex measures of the probability distribution of portfolio
returns (skewness, kurtosis, etc.)
Similarity between in-sample and out-of-sample performance
Robustness of
assets allocation procedureFinancial rocket scientists have a lot more to offer
Слайд 12Risk vs return
The risk and return trade-off is the main
principle of investing
Future return is uncertain
“Risk means more things
can happen than will happen” (LSE)Extreme movements are usually not anticipated on all time scales
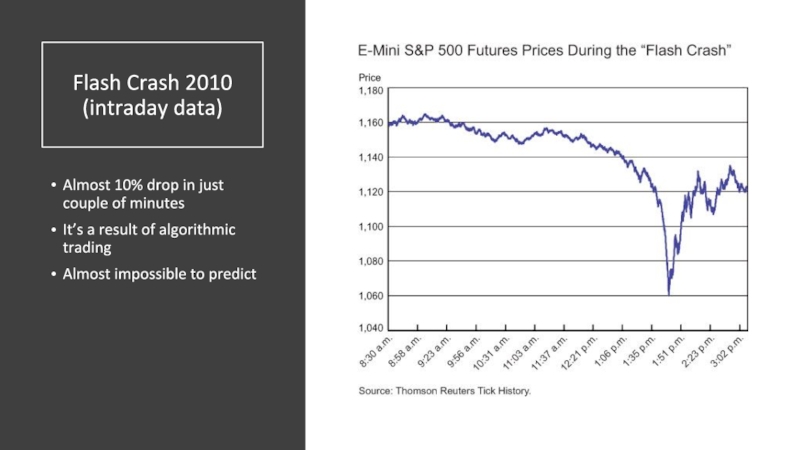
Слайд 14Flash Crash 2010
(intraday data)
Almost 10% drop in just couple of
minutes
It’s a result of algorithmic trading
Almost impossible to predict
Слайд 15Risk vs return
The risk and return trade-off is the main
principle of investing
Future return is uncertain
Extreme movements are usually
not anticipated on all time scalesRisk-return trade-off works because people are constantly searching for profits -> equilibrium
Is there a free lunch in finance?
Слайд 16Portfolio theory: outline
Naïve 1/n
Markowitz theory
Risk parity theory
Hierarchical risk parity
Слайд 17Diversification
Objective: lower our exposure to risk
If assets are negatively correlated,
you construct a low risk portfolio
The risk of the average
is not equal to the average of the risksBrent Crude and USDRUB example
Слайд 18Diversification
Objective: lower our exposure to risk
If assets are negatively correlated,
you construct a low risk portfolio
The risk of the average
is not equal to the average of the risksBrent Crude and USDRUB example
Data analysis can help you build better investment portfolios
Understanding the decision-making process is the starting point
Слайд 19Decision-making process
What is rational decision-making?
Imagine playing a game with the
following rules:
everybody picks any number between 0 and 100
the goal
is to guess 2/3 of the average of the numbers picked by all participantsWhat is the winning strategy?
Слайд 20Decision-making process
If everybody is rational, then you should pick 0!
Financial
markets are much harder to predict
Gather information: stocks prices, what
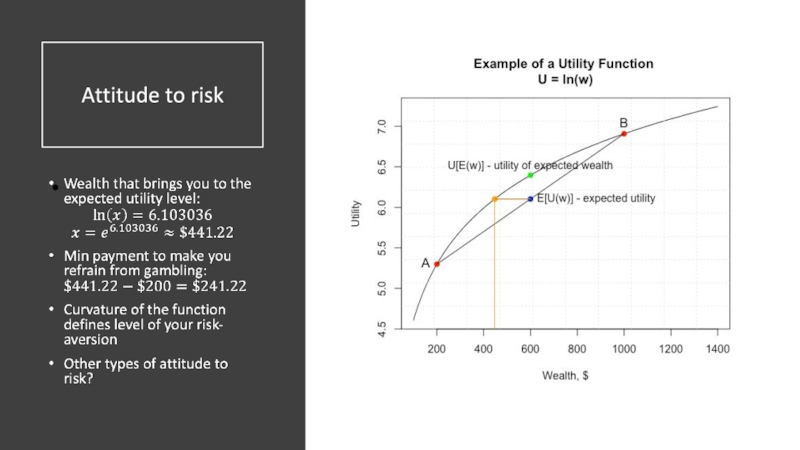
stocks move together, what is the probability of crash, etc.Decision-making (economics): optimization of the objective function and finding stocks that fulfill your goal
Decision-making (neuroscience): social background, cultural biases, amount of sleep, stress, how good was your cappuccino today – everything is important
Слайд 25Conclusions
Data analysis is a core element of modern financial theory
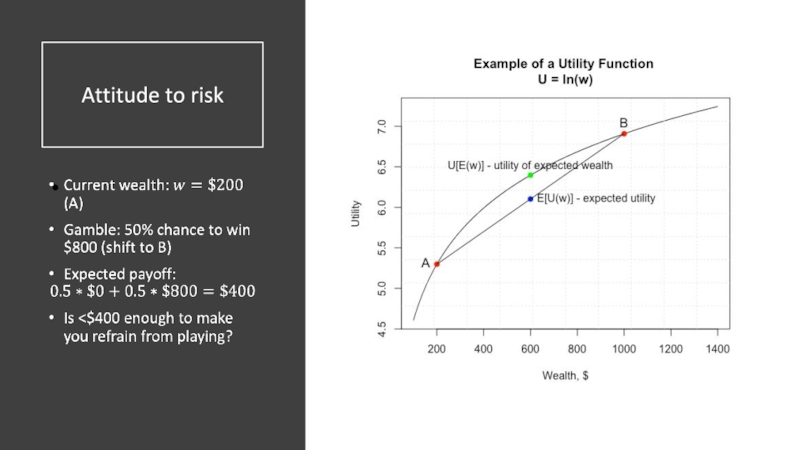
Utility
function is a way to formally describe individual preferences
Intuitively risk
seems to be an obvious conceptMeasuring risk is not trivial
Risk-return trade-off is the key principle of investing
Next time we’ll use real data to illustrate this trade-off













![Звуковая история Автоматизация звука [С] в прямом слоге и со стечением согласных](/img/tmb/7/638822/5f88ff8b5e1adadb4ef4610c87406b5e-800x.jpg)


