Разделы презентаций
- Разное
- Английский язык
- Астрономия
- Алгебра
- Биология
- География
- Геометрия
- Детские презентации
- Информатика
- История
- Литература
- Математика
- Медицина
- Менеджмент
- Музыка
- МХК
- Немецкий язык
- ОБЖ
- Обществознание
- Окружающий мир
- Педагогика
- Русский язык
- Технология
- Физика
- Философия
- Химия
- Шаблоны, картинки для презентаций
- Экология
- Экономика
- Юриспруденция
Financial analysis of company’s activity
Содержание
- 1. Financial analysis of company’s activity
- 2. Management accountingIt measures and reports financial and
- 3. Financial AccountingIts focus is on reporting to
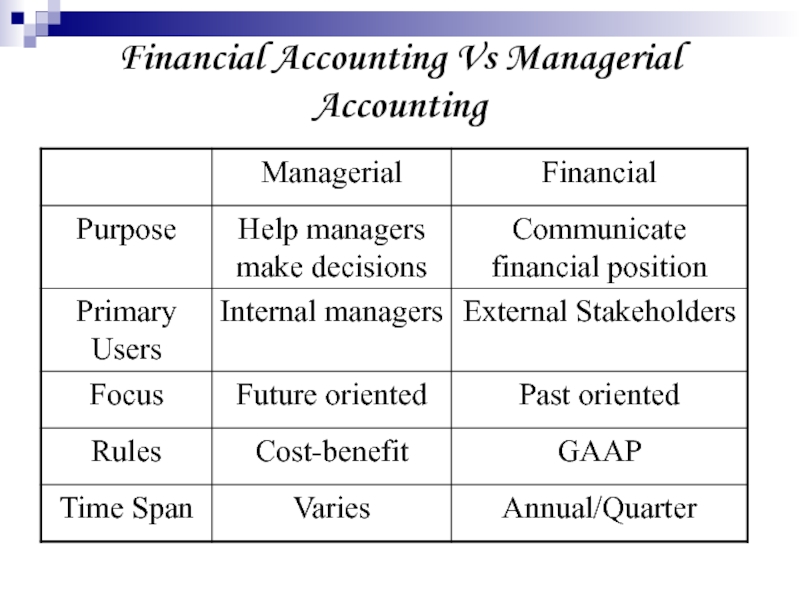
- 4. Financial Accounting Vs Managerial Accounting
- 5. Key Themes in Management Decision MakingCustomer FocusValue
- 6. Customer Focus – continuous process of investing
- 7. Key Success Factors (operational factors that directly
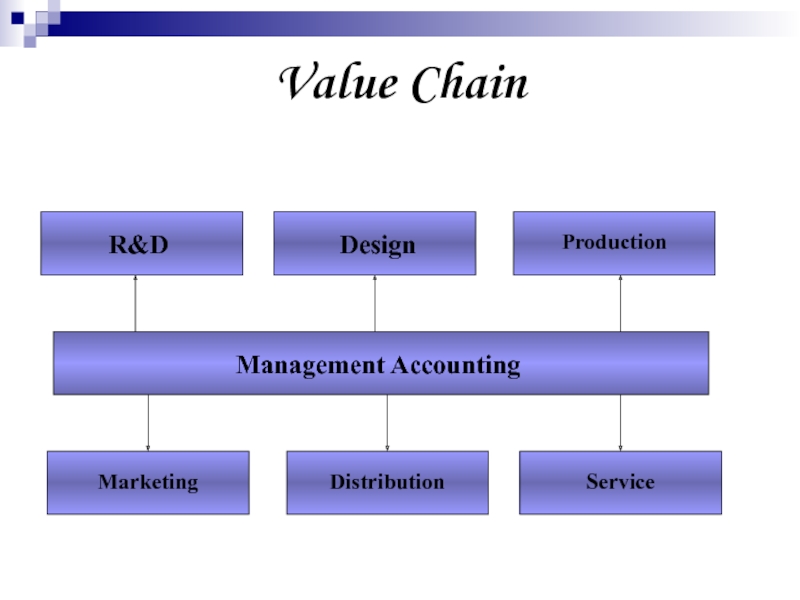
- 8. Value ChainRefers to the sequence of business
- 9. Value ChainR&DDesignProductionManagement AccountingMarketingDistributionService
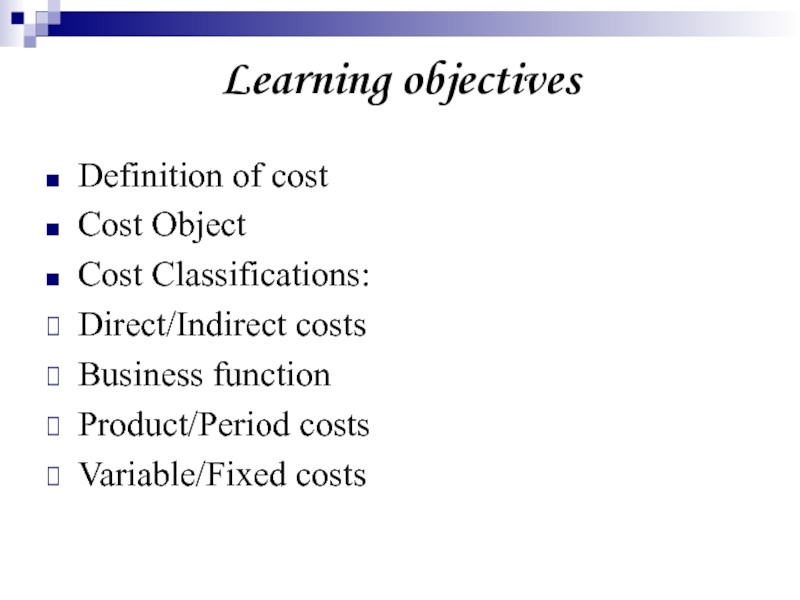
- 10. Learning objectivesDefinition of costCost ObjectCost Classifications:Direct/Indirect costsBusiness functionProduct/Period costsVariable/Fixed costs
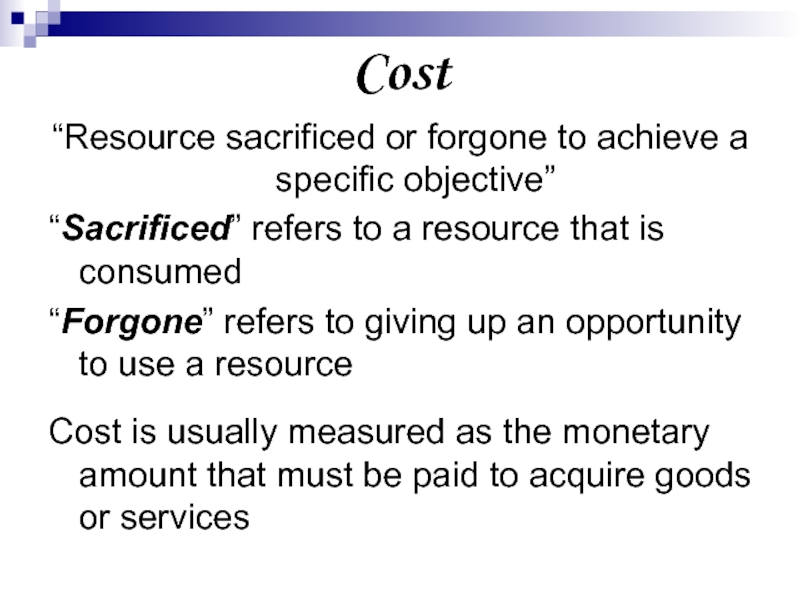
- 11. Cost“Resource sacrificed or forgone to achieve a
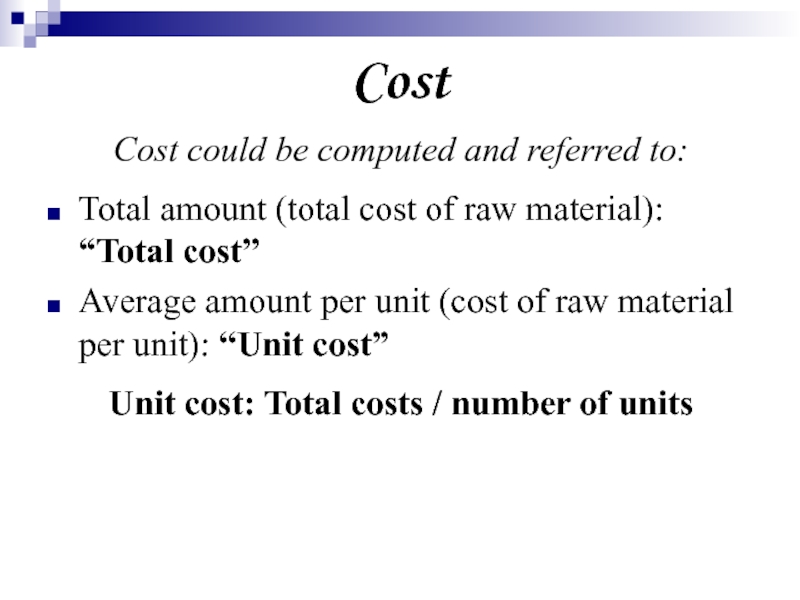
- 12. CostCost could be computed and referred to:Total
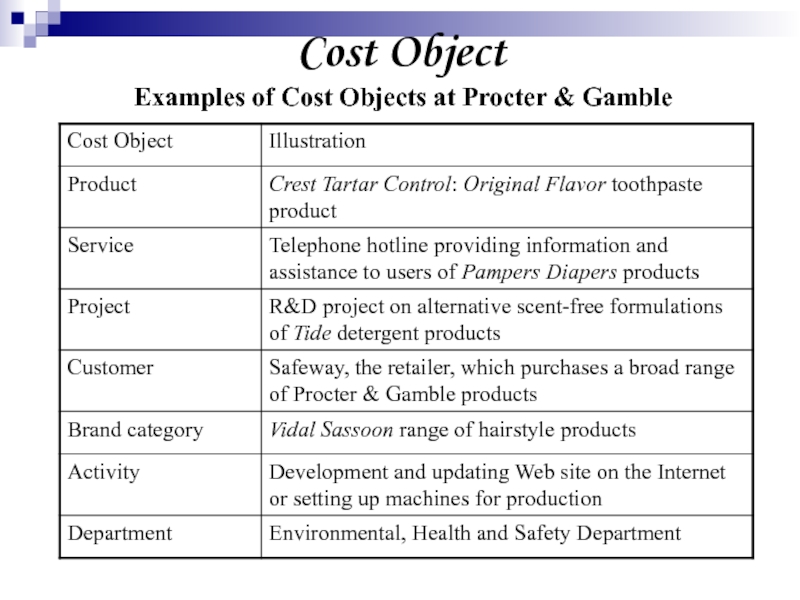
- 13. Cost ObjectExamples of Cost Objects at Procter & Gamble
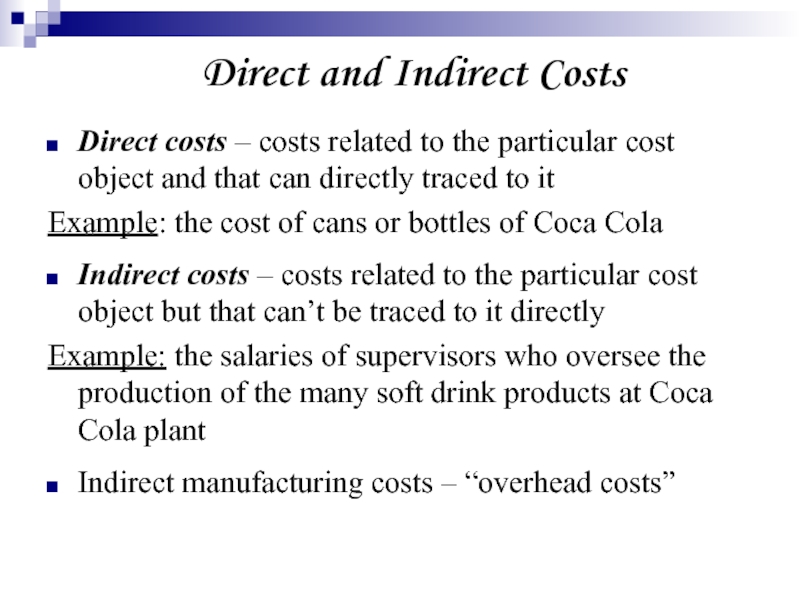
- 14. Direct and Indirect CostsDirect costs – costs
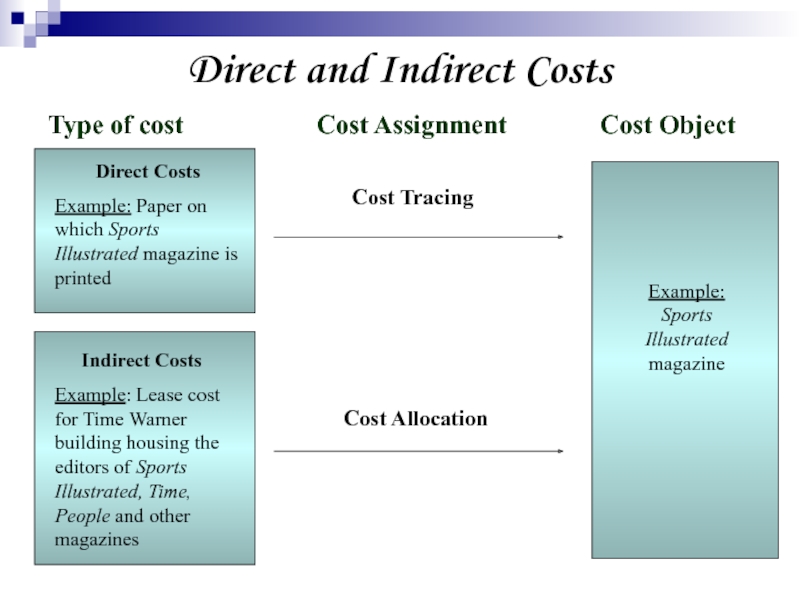
- 15. Type of cost
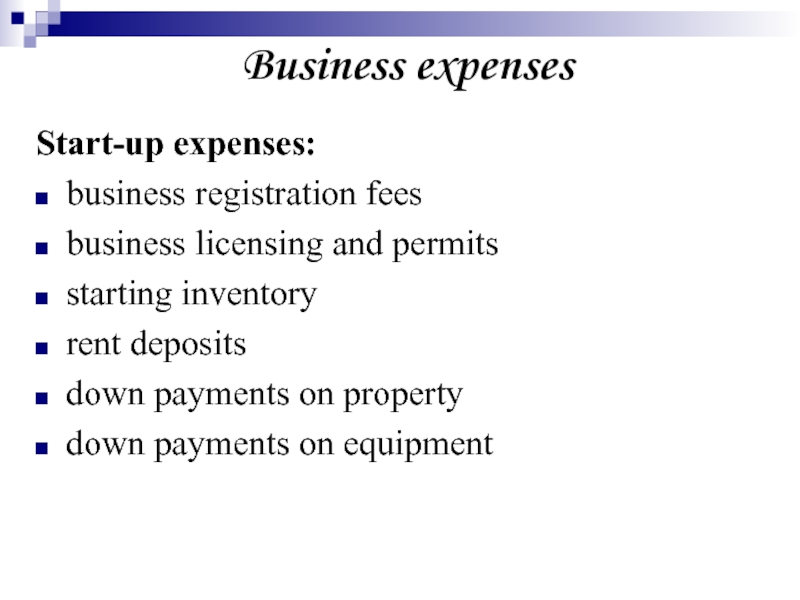
- 16. Business expensesStart-up expenses:business registration fees business licensing
- 17. Operating expenses:salaries (yours and staff salaries) telecommunicationsraw
- 18. Business functionR&D costsProduction costs (raw materials, direct
- 19. Manufacturing costs: ProductionNon-Manufacturing costs: R&D Marketing Customer ServiceBusiness function
- 20. Product and period costsProduct costs – all
- 21. Which costs become product costs?GAAP versionGAAP requires
- 22. Variable and Fixed costsVariable cost – cost
- 23. Cost BehaviourDo not assume that individual costs
- 24. Direct-Indirect, Fixed-Variable costsDirect CostsCost object: BMW X5s
- 25. BudgetOperating budget:Sales budgetProduction budgetDirect materials budgetDirect labor
- 26. Financial statementsBalance sheet: also referred to as
- 27. Financial ratio or accounting ratio Liquidity ratios
- 28. Profitability ratiosProfitability ratios measure the firm's use
- 29. Gross margin, Gross profit margin or
- 30. Operating margin, Operating Income Margin, Operating profit
- 31. Profit margin, Net Margin, Net profit margin
- 32. The Return on Assets (ROA) percentage shows
- 33. Profitability ratiosReturn on invested capital (ROIC) is
- 34. Liquidity ratiosLiquidity ratios measure the availability of
- 35. Activity ratiosActivity ratios measure the effectiveness of
- 36. Debt ratiosDebt ratios measure the firm's ability
- 37. Market ratiosMarket ratios measure investor response to
- 38. Thank you for your attention!
- 39. Скачать презентанцию
Слайды и текст этой презентации
Слайд 3Financial Accounting
Its focus is on reporting to external parties.
It
measures and records business transactions.
It provides financial statements based
on generally accepted accounting principles. Слайд 5Key Themes in Management Decision Making
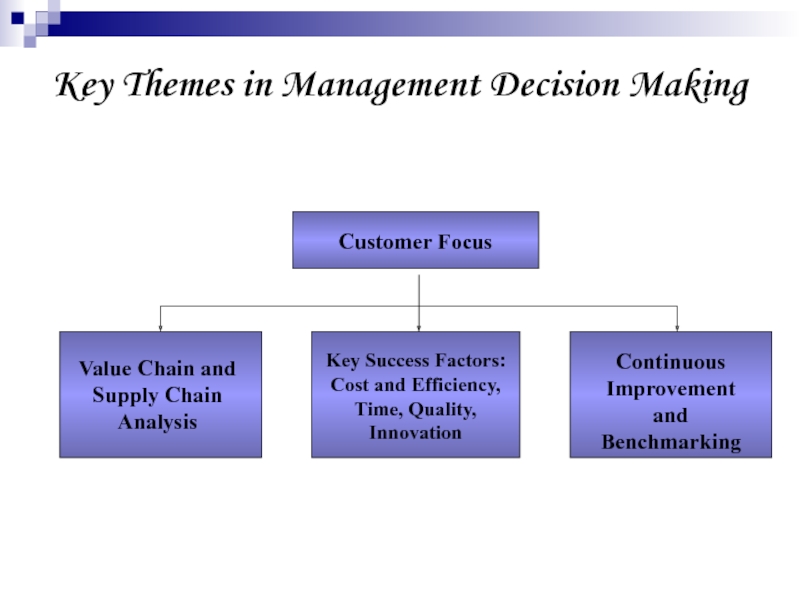
Customer Focus
Value Chain and Supply
Chain Analysis
Key Success Factors: Cost and Efficiency, Time, Quality,
InnovationContinuous Improvement and Benchmarking
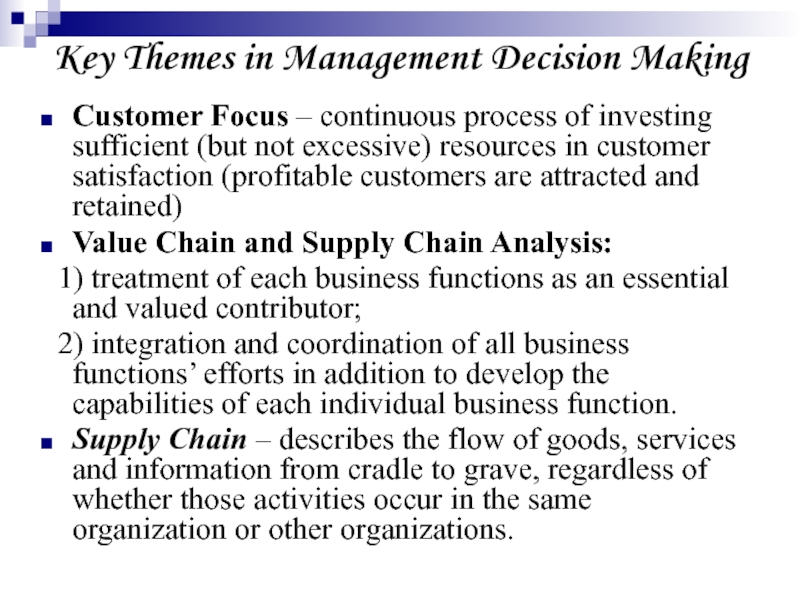
Слайд 6Customer Focus – continuous process of investing sufficient (but not
excessive) resources in customer satisfaction (profitable customers are attracted and
retained)Value Chain and Supply Chain Analysis:
1) treatment of each business functions as an essential and valued contributor;
2) integration and coordination of all business functions’ efforts in addition to develop the capabilities of each individual business function.
Supply Chain – describes the flow of goods, services and information from cradle to grave, regardless of whether those activities occur in the same organization or other organizations.
Key Themes in Management Decision Making
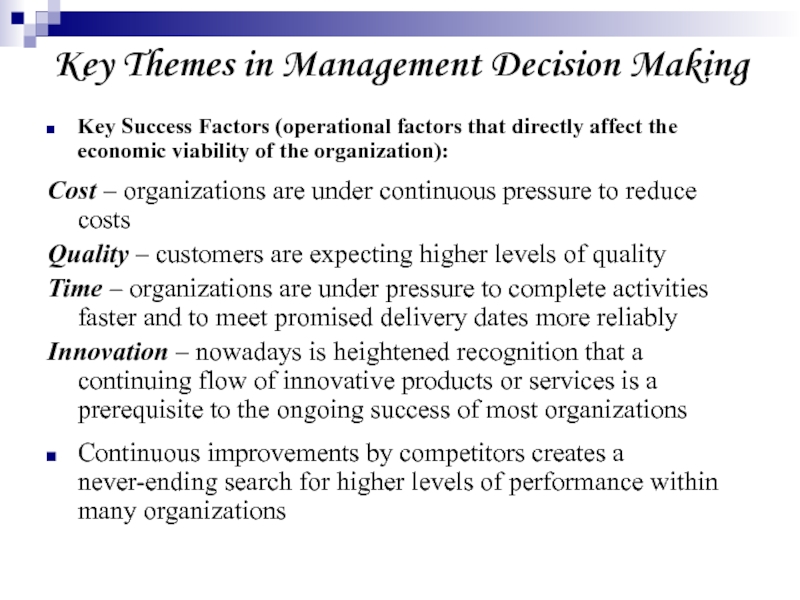
Слайд 7Key Success Factors (operational factors that directly affect the economic
viability of the organization):
Cost – organizations are under continuous pressure
to reduce costsQuality – customers are expecting higher levels of quality
Time – organizations are under pressure to complete activities faster and to meet promised delivery dates more reliably
Innovation – nowadays is heightened recognition that a continuing flow of innovative products or services is a prerequisite to the ongoing success of most organizations
Continuous improvements by competitors creates a never-ending search for higher levels of performance within many organizations
Key Themes in Management Decision Making
Слайд 8Value Chain
Refers to the sequence of business functions in which
usefulness is added to the products or services of an
organization (as the usefulness of the product or service is increased, so is its value to the customer)Слайд 10Learning objectives
Definition of cost
Cost Object
Cost Classifications:
Direct/Indirect costs
Business function
Product/Period costs
Variable/Fixed costs
Слайд 11Cost
“Resource sacrificed or forgone to achieve a specific objective”
“Sacrificed” refers
to a resource that is consumed
“Forgone” refers to giving up
an opportunity to use a resourceCost is usually measured as the monetary amount that must be paid to acquire goods or services
Слайд 12Cost
Cost could be computed and referred to:
Total amount (total cost
of raw material): “Total cost”
Average amount per unit (cost of
raw material per unit): “Unit cost”Unit cost: Total costs / number of units
Слайд 14Direct and Indirect Costs
Direct costs – costs related to the
particular cost object and that can directly traced to it
Example:
the cost of cans or bottles of Coca ColaIndirect costs – costs related to the particular cost object but that can’t be traced to it directly
Example: the salaries of supervisors who oversee the production of the many soft drink products at Coca Cola plant
Indirect manufacturing costs – “overhead costs”
Слайд 15Type of cost
Cost Assignment
Cost ObjectDirect and Indirect Costs
Direct Costs
Example: Paper on which Sports Illustrated magazine is printed
Indirect Costs
Example: Lease cost for Time Warner building housing the editors of Sports Illustrated, Time, People and other magazines
Cost Tracing
Cost Allocation
Example: Sports Illustrated magazine
Слайд 16Business expenses
Start-up expenses:
business registration fees
business licensing and permits
starting
inventory
rent deposits
down payments on property
down payments on
equipment Слайд 17Operating expenses:
salaries (yours and staff salaries)
telecommunications
raw materials
storage
distribution
promotion
loan payments
office supplies
maintenance
Business expenses
Слайд 18Business function
R&D costs
Production costs (raw materials, direct labour)
Selling costs (provisions
to vendors, advertising, promotion …)
Distribution costs (transport, contracts with distributors
…)General and administrative costs (electricity, telephone, rents, plant’ cleaning, office’ heating …)
Слайд 19Manufacturing costs:
Production
Non-Manufacturing costs:
R&D
Marketing
Customer Service
Business function
Слайд 20Product and period costs
Product costs – all costs of a
product that are considered as assets in the balance sheet
(inventory) when they are incurred and that become cost of goods sold when the product is soldPeriod costs – all costs in the income statement other than cost of goods sold; they are treated as expenses of the accounting period whatever the volume of production/sales is
Слайд 21Which costs become product costs?
GAAP version
GAAP requires “Full costing” for
external reporting purposes. As a result indirect production costs must
be allocated to goods producedCost Behaviour version
It depends on what the company is trying to achieve by means of financial analysis (strategic analysis, operating analysis, evaluation of inventory)
Слайд 22Variable and Fixed costs
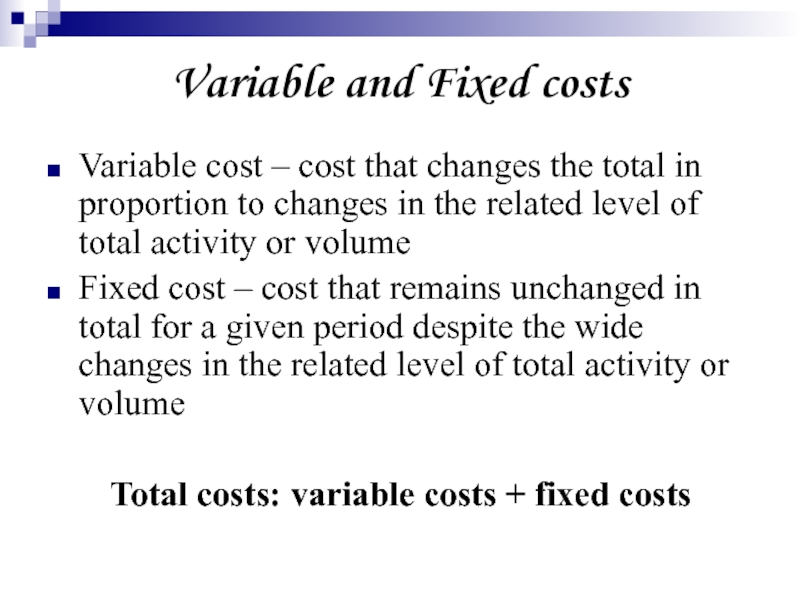
Variable cost – cost that changes the
total in proportion to changes in the related level of
total activity or volumeFixed cost – cost that remains unchanged in total for a given period despite the wide changes in the related level of total activity or volume
Total costs: variable costs + fixed costs
Слайд 23Cost Behaviour
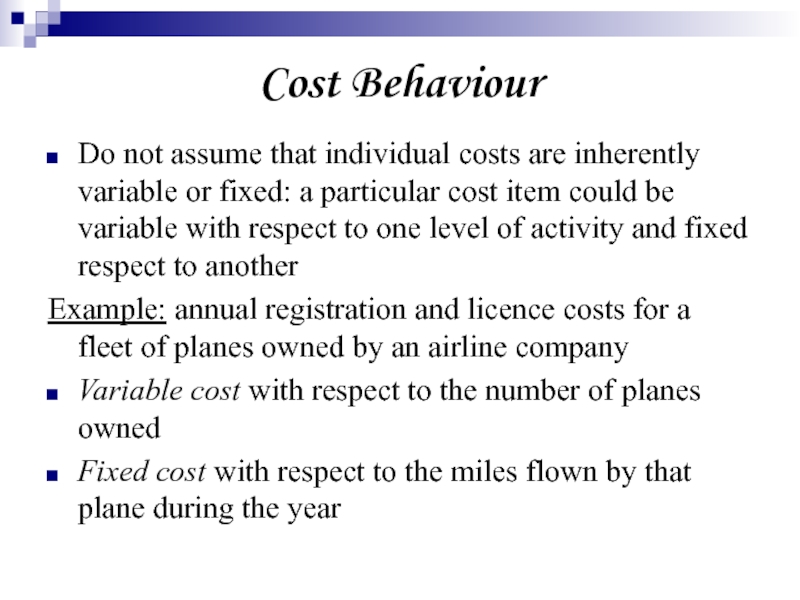
Do not assume that individual costs are inherently variable
or fixed: a particular cost item could be variable with
respect to one level of activity and fixed respect to anotherExample: annual registration and licence costs for a fleet of planes owned by an airline company
Variable cost with respect to the number of planes owned
Fixed cost with respect to the miles flown by that plane during the year
Слайд 24Direct-Indirect, Fixed-Variable costs
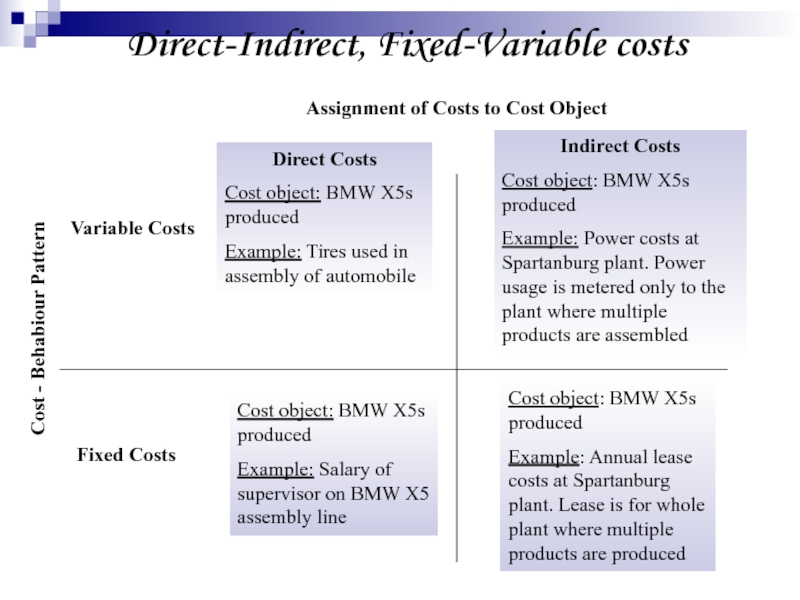
Direct Costs
Cost object: BMW X5s produced
Example: Tires used
in assembly of automobile
Cost object: BMW X5s produced
Example: Salary of
supervisor on BMW X5 assembly lineIndirect Costs
Cost object: BMW X5s produced
Example: Power costs at Spartanburg plant. Power usage is metered only to the plant where multiple products are assembled
Cost object: BMW X5s produced
Example: Annual lease costs at Spartanburg plant. Lease is for whole plant where multiple products are produced
Variable Costs
Fixed Costs
Assignment of Costs to Cost Object
Cost - Behabiour Pattern
Слайд 25Budget
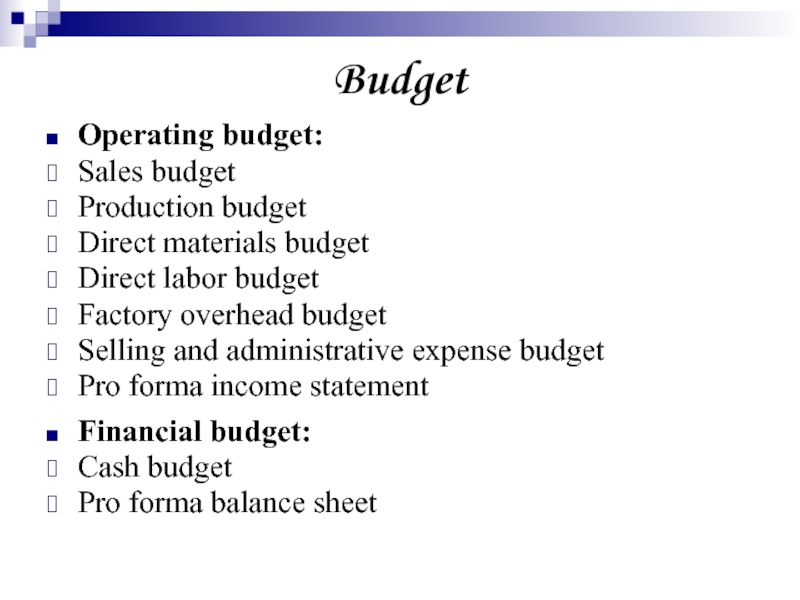
Operating budget:
Sales budget
Production budget
Direct materials budget
Direct labor budget
Factory overhead budget
Selling
and administrative expense budget
Pro forma income statement
Financial budget:
Cash budget
Pro forma
balance sheetСлайд 26Financial statements
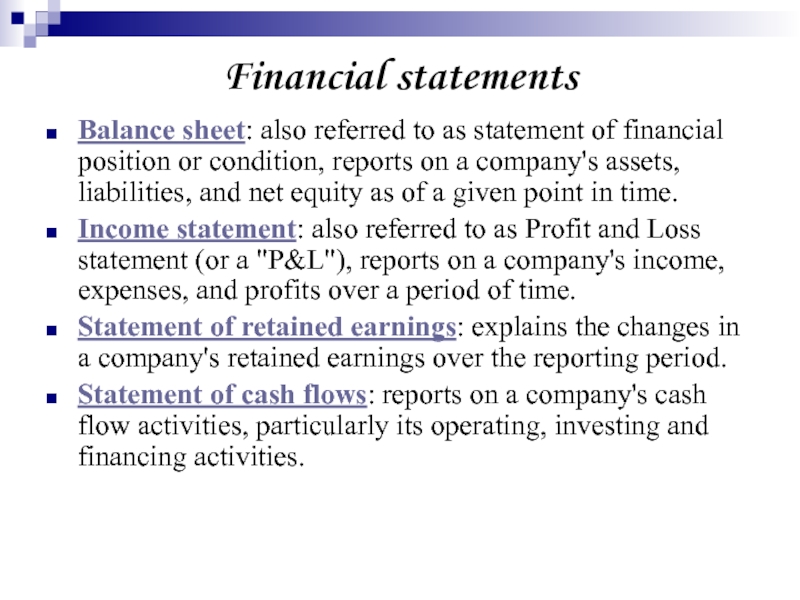
Balance sheet: also referred to as statement of financial
position or condition, reports on a company's assets, liabilities, and
net equity as of a given point in time.Income statement: also referred to as Profit and Loss statement (or a "P&L"), reports on a company's income, expenses, and profits over a period of time.
Statement of retained earnings: explains the changes in a company's retained earnings over the reporting period.
Statement of cash flows: reports on a company's cash flow activities, particularly its operating, investing and financing activities.
Слайд 27Financial ratio or accounting ratio
Liquidity ratios measure the availability
of cash to pay debt.
Activity ratios measure how quickly a
firm converts non-cash assets to cash assets.Debt ratios measure the firm's ability to repay long-term debt.
Profitability ratios measure the firm's use of its assets and control of its expenses to generate an acceptable rate of return.
Market ratios measure investor response to owning a company's stock and also the cost of issuing stock.
Слайд 28Profitability ratios
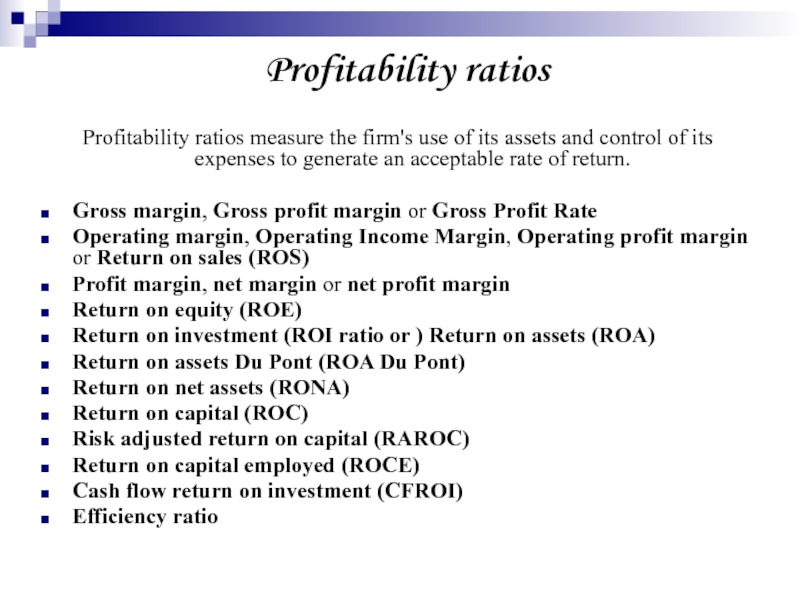
Profitability ratios measure the firm's use of its assets
and control of its expenses to generate an acceptable rate
of return.Gross margin, Gross profit margin or Gross Profit Rate
Operating margin, Operating Income Margin, Operating profit margin or Return on sales (ROS)
Profit margin, net margin or net profit margin
Return on equity (ROE)
Return on investment (ROI ratio or ) Return on assets (ROA)
Return on assets Du Pont (ROA Du Pont)
Return on net assets (RONA)
Return on capital (ROC)
Risk adjusted return on capital (RAROC)
Return on capital employed (ROCE)
Cash flow return on investment (CFROI)
Efficiency ratio
Слайд 29
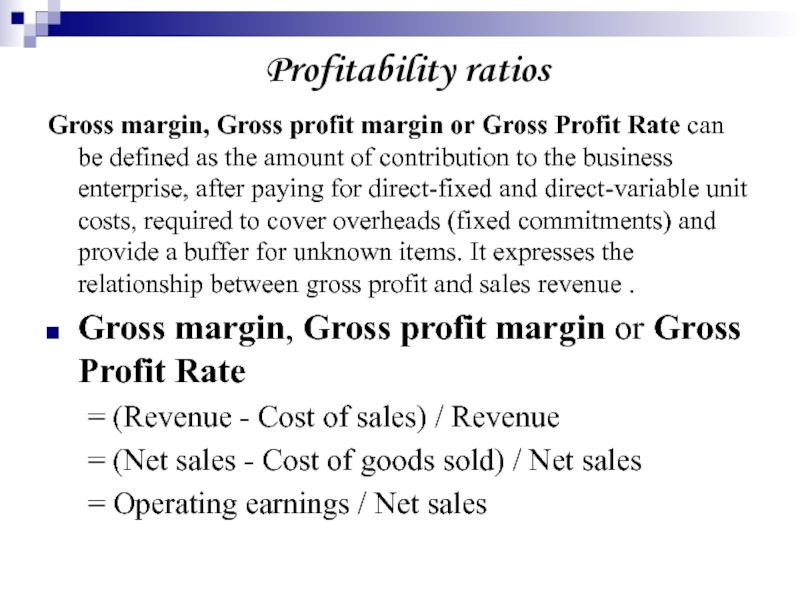
Gross margin, Gross profit margin or Gross Profit Rate can
be defined as the amount of contribution to the business
enterprise, after paying for direct-fixed and direct-variable unit costs, required to cover overheads (fixed commitments) and provide a buffer for unknown items. It expresses the relationship between gross profit and sales revenue .Gross margin, Gross profit margin or Gross Profit Rate
= (Revenue - Cost of sales) / Revenue
= (Net sales - Cost of goods sold) / Net sales
= Operating earnings / Net sales
Profitability ratios
Слайд 30Operating margin, Operating Income Margin, Operating profit margin or Return
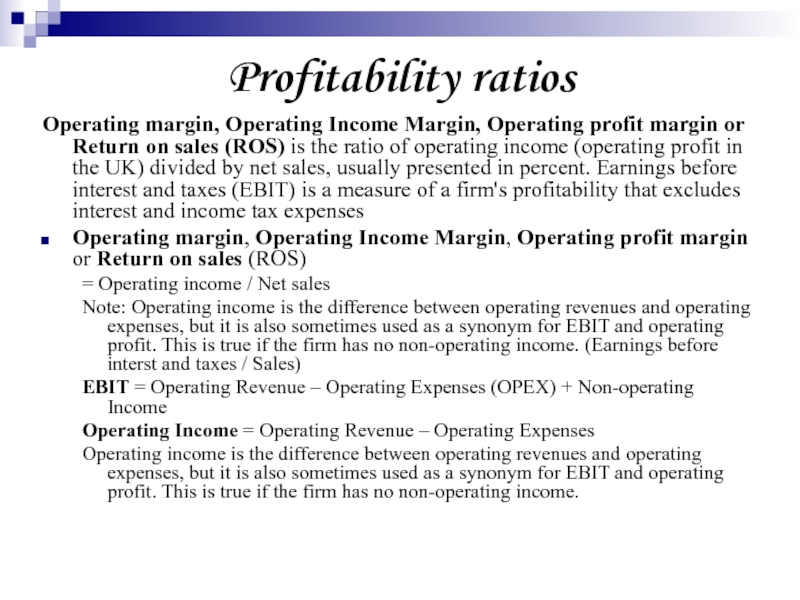
on sales (ROS) is the ratio of operating income (operating
profit in the UK) divided by net sales, usually presented in percent. Earnings before interest and taxes (EBIT) is a measure of a firm's profitability that excludes interest and income tax expensesOperating margin, Operating Income Margin, Operating profit margin or Return on sales (ROS)
= Operating income / Net sales
Note: Operating income is the difference between operating revenues and operating expenses, but it is also sometimes used as a synonym for EBIT and operating profit. This is true if the firm has no non-operating income. (Earnings before interst and taxes / Sales)
EBIT = Operating Revenue – Operating Expenses (OPEX) + Non-operating Income
Operating Income = Operating Revenue – Operating Expenses
Operating income is the difference between operating revenues and operating expenses, but it is also sometimes used as a synonym for EBIT and operating profit. This is true if the firm has no non-operating income.
Profitability ratios
Слайд 31Profit margin, Net Margin, Net profit margin or Net Profit
Ratio all refer to a measure of profitability.
Profit margin,
net margin or net profit margin = Net income / Sales
= Net profits after taxes / Sales
Net income is equal to the income that a firm has after subtracting costs and expenses from the total revenue. Net income can be distributed among holders of common stock as a dividend or held by the firm as retained earnings. Net income is an accounting term; in some countries (such as the UK) profit is the usual term. Often, the term income is substituted for net income, yet this is not preferred due to the possible ambiguity.
Return on Equity (ROE, Return on average common equity, return on net worth) measures the rate of return on the ownership interest (shareholders\ equity) of the common stock owners. ROE is viewed as one of the most important financial ratios. It measures a firm's efficiency at generating profits from every dollar of net assets (assets minus liabilities), and shows how well a company uses investment dollars to generate earnings growth. ROE is equal to a fiscal year’s net income (after preferred stock dividends but before common stock dividends) divided by total equity (excluding preferred shares)
Return on equity (ROE)
= Net profits after taxes / Stockholders' equity or tangible net worth
= Net profit / Equity
Rate of return (ROR), also known as return on investment (ROI), rate of profit or sometimes just return, is the ratio of money gained or lost (realized or unrealized) on an investment relative to the amount of money invested. The amount of money gained or lost may be referred to as interst, profit / loss, gain/loss, or net income/loss. The money invested may be referred to as the asset, capital, principal or the cost basis of the investment.
Return on investment (ROI ratio or ) = Net income / Total Assets
Profitability ratios
Слайд 32
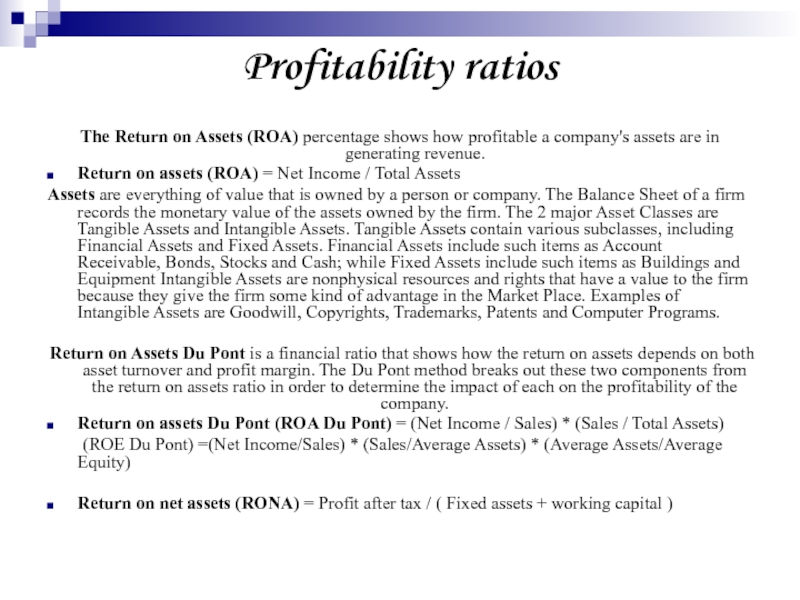
The Return on Assets (ROA) percentage shows how profitable a
company's assets are in generating revenue.
Return on assets (ROA) =
Net Income / Total AssetsAssets are everything of value that is owned by a person or company. The Balance Sheet of a firm records the monetary value of the assets owned by the firm. The 2 major Asset Classes are Tangible Assets and Intangible Assets. Tangible Assets contain various subclasses, including Financial Assets and Fixed Assets. Financial Assets include such items as Account Receivable, Bonds, Stocks and Cash; while Fixed Assets include such items as Buildings and Equipment Intangible Assets are nonphysical resources and rights that have a value to the firm because they give the firm some kind of advantage in the Market Place. Examples of Intangible Assets are Goodwill, Copyrights, Trademarks, Patents and Computer Programs.
Return on Assets Du Pont is a financial ratio that shows how the return on assets depends on both asset turnover and profit margin. The Du Pont method breaks out these two components from the return on assets ratio in order to determine the impact of each on the profitability of the company.
Return on assets Du Pont (ROA Du Pont) = (Net Income / Sales) * (Sales / Total Assets)
(ROE Du Pont) =(Net Income/Sales) * (Sales/Average Assets) * (Average Assets/Average Equity)
Return on net assets (RONA) = Profit after tax / ( Fixed assets + working capital )
Profitability ratios
Слайд 33Profitability ratios
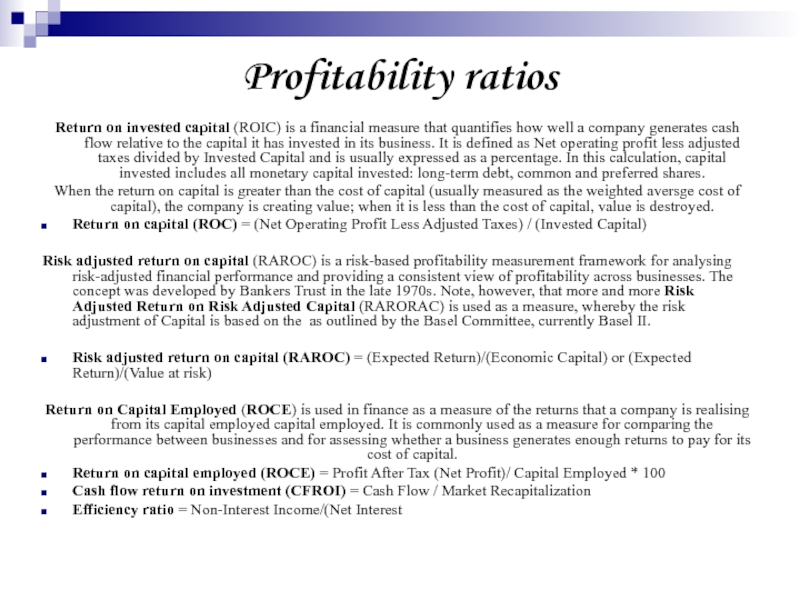
Return on invested capital (ROIC) is a financial measure
that quantifies how well a company generates cash flow relative
to the capital it has invested in its business. It is defined as Net operating profit less adjusted taxes divided by Invested Capital and is usually expressed as a percentage. In this calculation, capital invested includes all monetary capital invested: long-term debt, common and preferred shares.When the return on capital is greater than the cost of capital (usually measured as the weighted aversge cost of capital), the company is creating value; when it is less than the cost of capital, value is destroyed.
Return on capital (ROC) = (Net Operating Profit Less Adjusted Taxes) / (Invested Capital)
Risk adjusted return on capital (RAROC) is a risk-based profitability measurement framework for analysing risk-adjusted financial performance and providing a consistent view of profitability across businesses. The concept was developed by Bankers Trust in the late 1970s. Note, however, that more and more Risk Adjusted Return on Risk Adjusted Capital (RARORAC) is used as a measure, whereby the risk adjustment of Capital is based on the as outlined by the Basel Committee, currently Basel II.
Risk adjusted return on capital (RAROC) = (Expected Return)/(Economic Capital) or (Expected Return)/(Value at risk)
Return on Capital Employed (ROCE) is used in finance as a measure of the returns that a company is realising from its capital employed capital employed. It is commonly used as a measure for comparing the performance between businesses and for assessing whether a business generates enough returns to pay for its cost of capital.
Return on capital employed (ROCE) = Profit After Tax (Net Profit)/ Capital Employed * 100
Cash flow return on investment (CFROI) = Cash Flow / Market Recapitalization
Efficiency ratio = Non-Interest Income/(Net Interest
Слайд 34Liquidity ratios
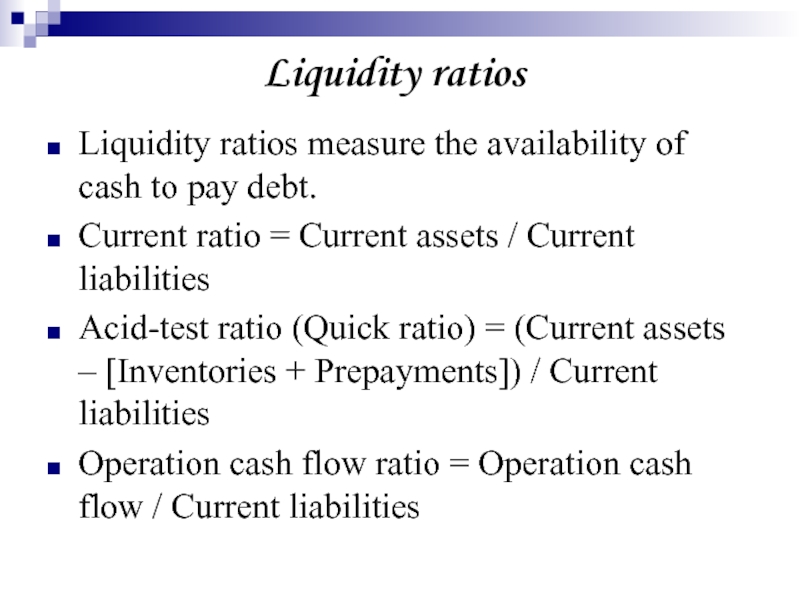
Liquidity ratios measure the availability of cash to pay
debt.
Current ratio = Current assets / Current liabilities
Acid-test ratio (Quick
ratio) = (Current assets – [Inventories + Prepayments]) / Current liabilitiesOperation cash flow ratio = Operation cash flow / Current liabilities
Слайд 35Activity ratios
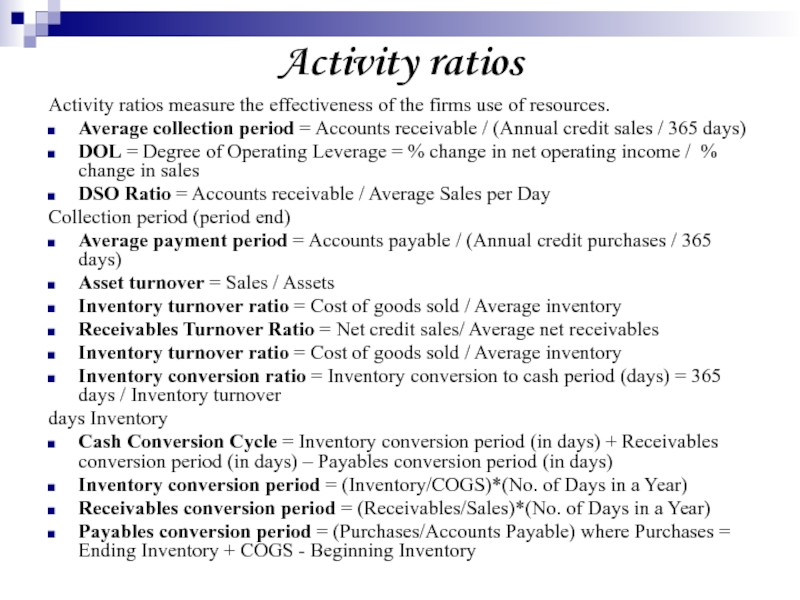
Activity ratios measure the effectiveness of the firms use
of resources.
Average collection period = Accounts receivable / (Annual credit
sales / 365 days)DOL = Degree of Operating Leverage = % change in net operating income / % change in sales
DSO Ratio = Accounts receivable / Average Sales per Day
Collection period (period end)
Average payment period = Accounts payable / (Annual credit purchases / 365 days)
Asset turnover = Sales / Assets
Inventory turnover ratio = Cost of goods sold / Average inventory
Receivables Turnover Ratio = Net credit sales/ Average net receivables
Inventory turnover ratio = Cost of goods sold / Average inventory
Inventory conversion ratio = Inventory conversion to cash period (days) = 365 days / Inventory turnover
days Inventory
Cash Conversion Cycle = Inventory conversion period (in days) + Receivables conversion period (in days) – Payables conversion period (in days)
Inventory conversion period = (Inventory/COGS)*(No. of Days in a Year)
Receivables conversion period = (Receivables/Sales)*(No. of Days in a Year)
Payables conversion period = (Purchases/Accounts Payable) where Purchases = Ending Inventory + COGS - Beginning Inventory
Слайд 36Debt ratios
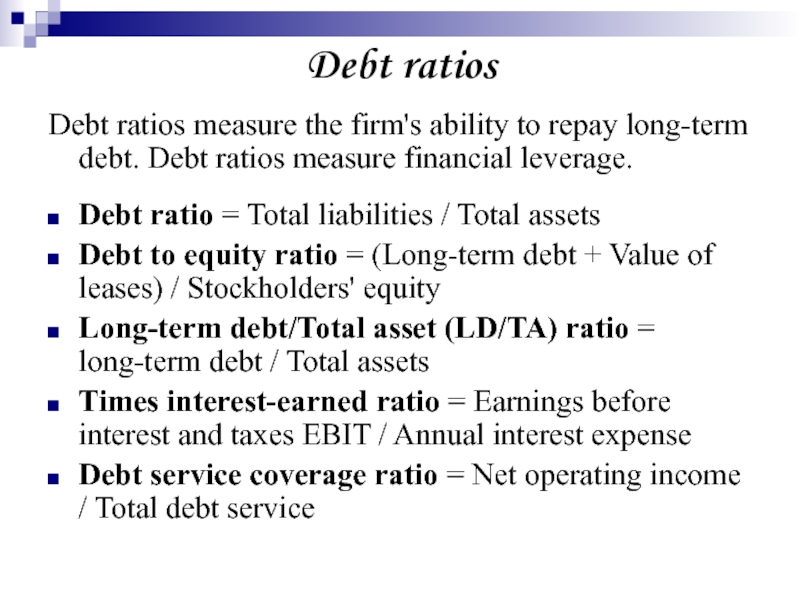
Debt ratios measure the firm's ability to repay long-term
debt. Debt ratios measure financial leverage.
Debt ratio = Total liabilities
/ Total assetsDebt to equity ratio = (Long-term debt + Value of leases) / Stockholders' equity
Long-term debt/Total asset (LD/TA) ratio = long-term debt / Total assets
Times interest-earned ratio = Earnings before interest and taxes EBIT / Annual interest expense
Debt service coverage ratio = Net operating income / Total debt service
Слайд 37Market ratios
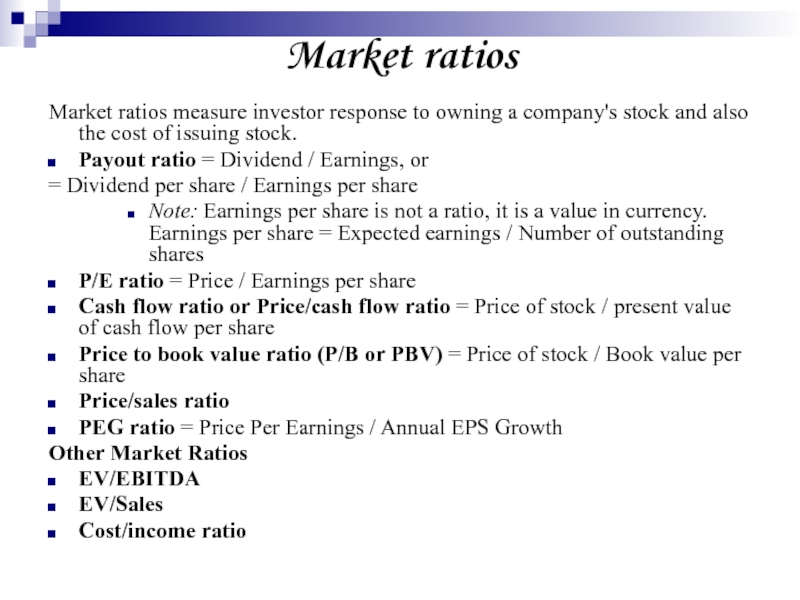
Market ratios measure investor response to owning a company's
stock and also the cost of issuing stock.
Payout ratio =
Dividend / Earnings, or = Dividend per share / Earnings per share
Note: Earnings per share is not a ratio, it is a value in currency. Earnings per share = Expected earnings / Number of outstanding shares
P/E ratio = Price / Earnings per share
Cash flow ratio or Price/cash flow ratio = Price of stock / present value of cash flow per share
Price to book value ratio (P/B or PBV) = Price of stock / Book value per share
Price/sales ratio
PEG ratio = Price Per Earnings / Annual EPS Growth
Other Market Ratios
EV/EBITDA
EV/Sales
Cost/income ratio
