Разделы презентаций
- Разное
- Английский язык
- Астрономия
- Алгебра
- Биология
- География
- Геометрия
- Детские презентации
- Информатика
- История
- Литература
- Математика
- Медицина
- Менеджмент
- Музыка
- МХК
- Немецкий язык
- ОБЖ
- Обществознание
- Окружающий мир
- Педагогика
- Русский язык
- Технология
- Физика
- Философия
- Химия
- Шаблоны, картинки для презентаций
- Экология
- Экономика
- Юриспруденция
Lecture 2. Situational analysis of the enterprise
Содержание
- 1. Lecture 2. Situational analysis of the enterprise
- 2. Agenda 2.1 Situational analysis: meaning 2.2 Analysis
- 3. What is Situational analysisDesigned to determine the
- 4. Situational analysis contributes to a better awareness
- 5. situation analysis SWOT-analysis;analysis of the strategic position
- 6. Слайд 6
- 7. 2.2 Analysis of the strategic position of
- 8. Strategic Economic Zonesthe Strategic Economic Zones is
- 9. The detection of the Strategic Economic Zones
- 10. A direct analysis of the strategic position
- 11. Boston Consulting Group matrixSuch "stars" generate a
- 12. how to build and analyze bcg matrix1.
- 13. how to build and analyze ВСG matrix
- 14. Слайд 14
- 15. Stars: The business units or products that have
- 16. managerial and commercial decisions Stars - maintaining
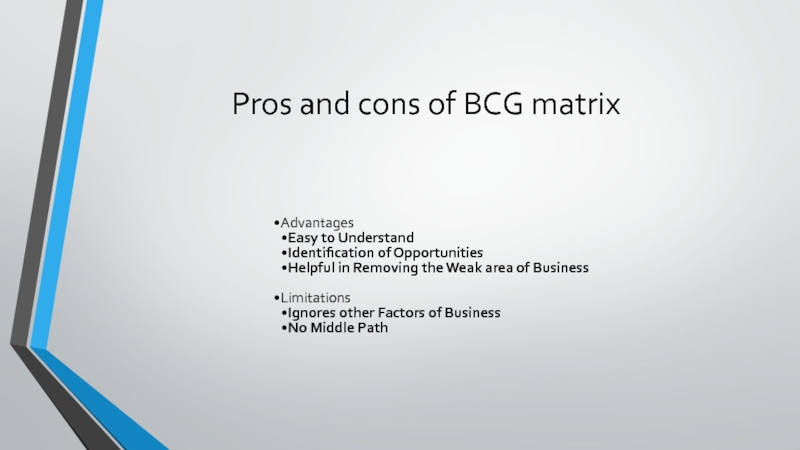
- 17. Pros and cons of BCG matrix
- 18. AD Little matrixTo gain more insight into
- 19. Слайд 19
- 20. Слайд 20
- 21. Competitive positionDominant. At this stage there is
- 22. Shell International matrixThis tool is used for
- 23. Матрица Shell
- 24. business screen McKinsey / GEThe GE-McKinsey nine-box
- 25. Слайд 25
- 26. Ansoff’s growth strategy matrixA model that describes
- 27. Слайд 27
- 28. Ansoff's matrix provides four different growth strategies: Market
- 29. The analysis model of Michael Porter's five
- 30. Слайд 30
- 31. Competitive Rivalry. This looks at the number and
- 32. 2.3 ANALYSIS OF MARKET SEGMENTSSegmentation is the
- 33. S-T-P approachToday, Segmentation, Targeting and Positioning (STP)
- 34. Types of market segmentation
- 35. Types of segmentation1. Demographics (age, gender, income,
- 36. The essence is that the company's management
- 37. Choosing the best segment to operate, the
- 38. 2.4 ANALYSIS OF COMPETITION
- 39. Understanding the existing state of the company,
- 40. Competitive analysis or competitive research is a field of strategic
- 41. How to Conduct Your Competitive Analysis1. Identify
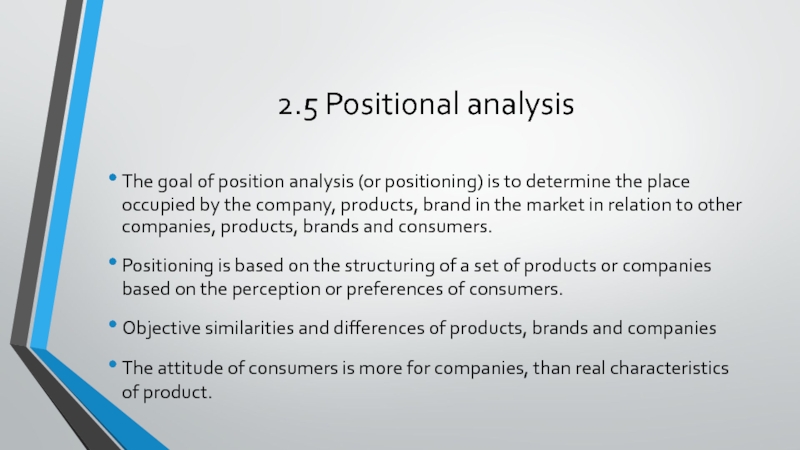
- 42. 2.5 Positional analysisThe goal of position analysis
- 43. Слайд 43
- 44. Скачать презентанцию
Agenda 2.1 Situational analysis: meaning 2.2 Analysis of the strategic position;2.3 Analysis of market segments;2.4 Analysis of competition;2.5 Positional analysis.
Слайды и текст этой презентации
Слайд 3What is Situational analysis
Designed to determine the situation in which
the enterprise is located, i.e. the place it occupies in
the general business space, the main factors affecting the functioning of the enterprise, as well as its aggregated characteristics in general.Situation analysis is a comprehensive analysis of capturing all relevant information and factors (internal and external) that affect the current and future situation of the organization.
Слайд 4Situational analysis contributes to a better awareness of the company
resources, products, the prosperity, the market situation and possible future
development directions.Therefore it helps significantly during strategic decision processes.
The result of situational analysis as a basis for creating strategies, plans or proposals of possible scenarios for the future conduct of the company.
Слайд 5situation analysis
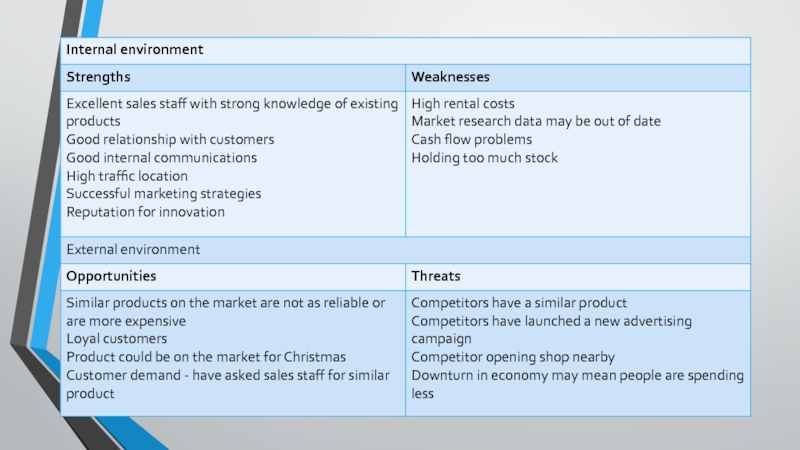
SWOT-analysis;
analysis of the strategic position occupied by the
company;
analysis of market segments;
analysis of competition;
positional analysis.
Слайд 72.2 Analysis of the strategic position of the company
is identifying
strategic economic zones, their interrelationships, surroundings and other important characteristics.
strategic
analysis, analysis of the strategic portfolio,
analysis of the strategic set
Слайд 8Strategic Economic Zones
the Strategic Economic Zones is a segment of
the company's environment for which it has an outlet or
plans to get such an outlet.The location of resources for different Strategic Economic Zones, the relationship of Strategic Economic Zones between themselves and the external environment determine the strategic position of the company.
Слайд 9The detection of the Strategic Economic Zones occurs in the
following order. The strategic zone is determined by the needs
of the market, technology, customer type and geographic area.The defining indicators of the development of Strategic Economic Zones are:
phase of development (phase of the life cycle);
market size;
purchasing power (solvent demand);
existing barriers to entry;
habits of customers;
the composition of competitors;
type and intensity of competition;
the main distribution channels;
state regulation;
Indicators of external environment development (economic, social, political, technological)
Слайд 10A direct analysis of the strategic position of the enterprise
is carried out through the following means:
matrix BCG;
matrix AD Little;
Shell
matrix;business screen McKinsey / GE;
matrix Ansoff and Porter.
Слайд 11Boston Consulting Group matrix
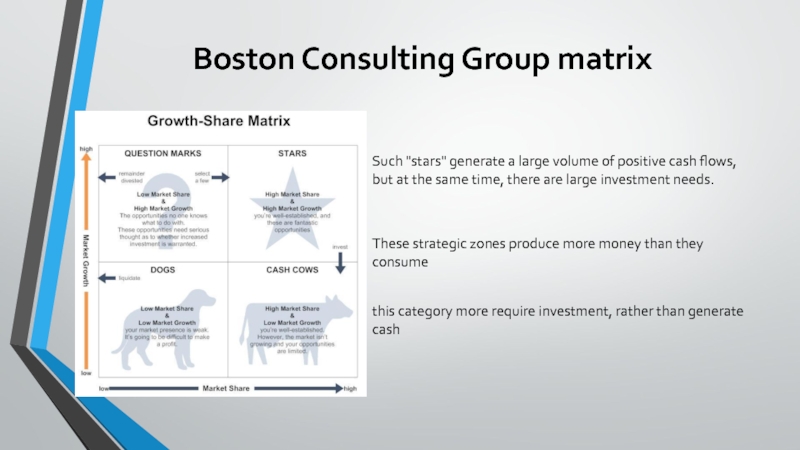
Such "stars" generate a large volume of
positive cash flows, but at the same time, there are
large investment needs.this category more require investment, rather than generate cash
These strategic zones produce more money than they consume
Слайд 12how to build and analyze bcg matrix
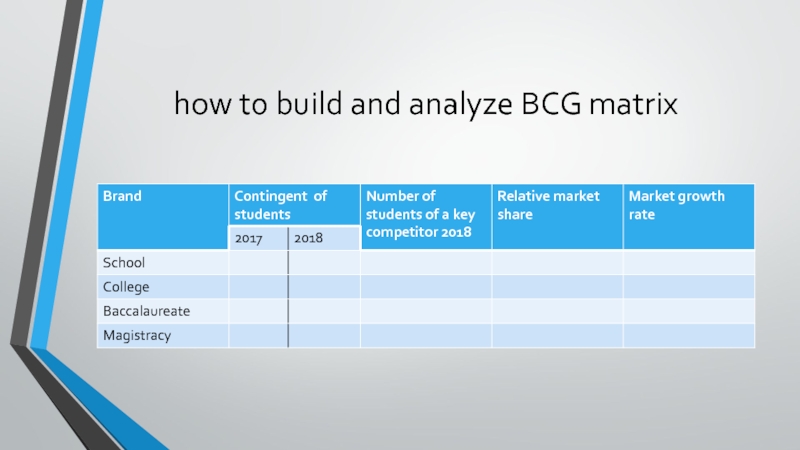
1. The first step
is to make a list of those goods, units or
companies that will be analyzed using the BCG matrix.2. Defining the market is one of the most important things to do in this analysis
3. Calculate relative market share. Relative market share can be calculated in terms of revenues or market share. It is calculated by dividing your own brand’s market share (revenues) by the market share (or revenues) of your largest competitor in that industry.
4. Find out market growth rate. The industry growth rate can be found in industry reports, which are usually available online for free.
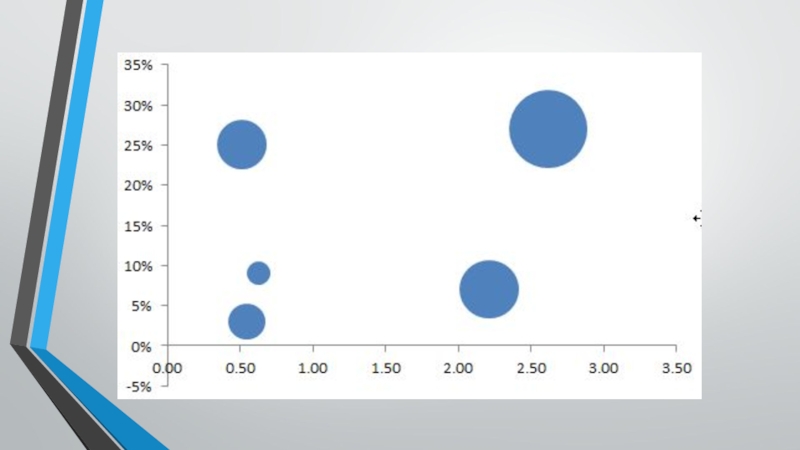
5. Draw the circles on a matrix. After calculating all the measures, you should be able to plot your brands on the matrix. You should do this by drawing a circle for each brand.
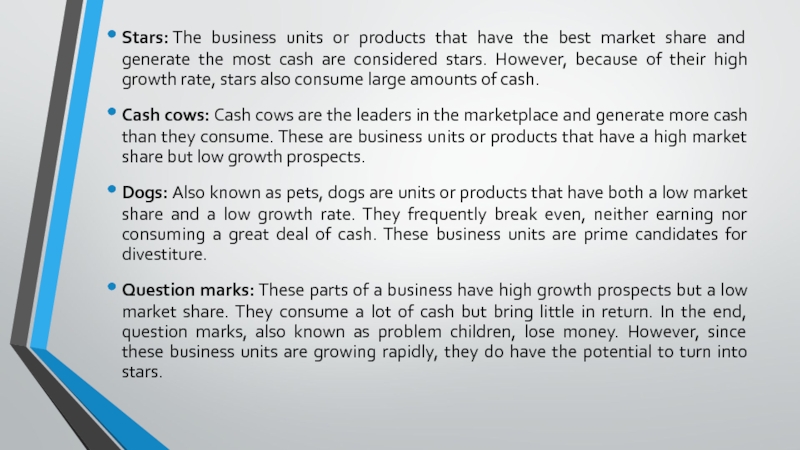
Слайд 15Stars: The business units or products that have the best market
share and generate the most cash are considered stars. However,
because of their high growth rate, stars also consume large amounts of cash.Cash cows: Cash cows are the leaders in the marketplace and generate more cash than they consume. These are business units or products that have a high market share but low growth prospects.
Dogs: Also known as pets, dogs are units or products that have both a low market share and a low growth rate. They frequently break even, neither earning nor consuming a great deal of cash. These business units are prime candidates for divestiture.
Question marks: These parts of a business have high growth prospects but a low market share. They consume a lot of cash but bring little in return. In the end, question marks, also known as problem children, lose money. However, since these business units are growing rapidly, they do have the potential to turn into stars.
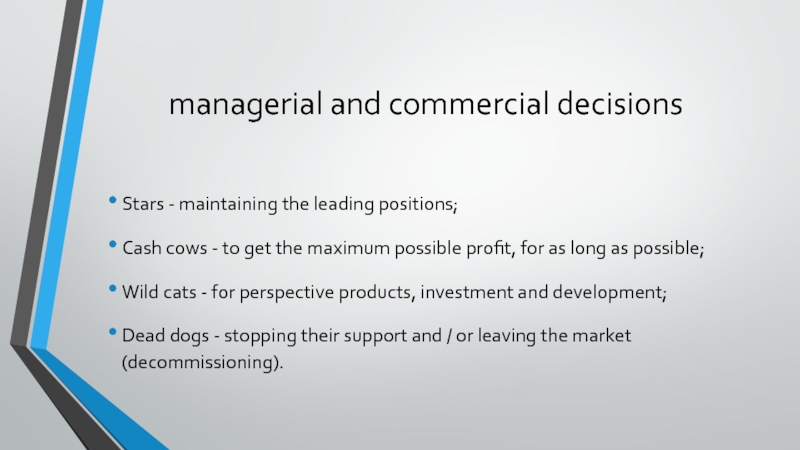
Слайд 16managerial and commercial decisions
Stars - maintaining the leading positions;
Cash cows - to get the maximum possible profit, for
as long as possible; Wild cats - for perspective products, investment and development;
Dead dogs - stopping their support and / or leaving the market (decommissioning).
Слайд 18AD Little matrix
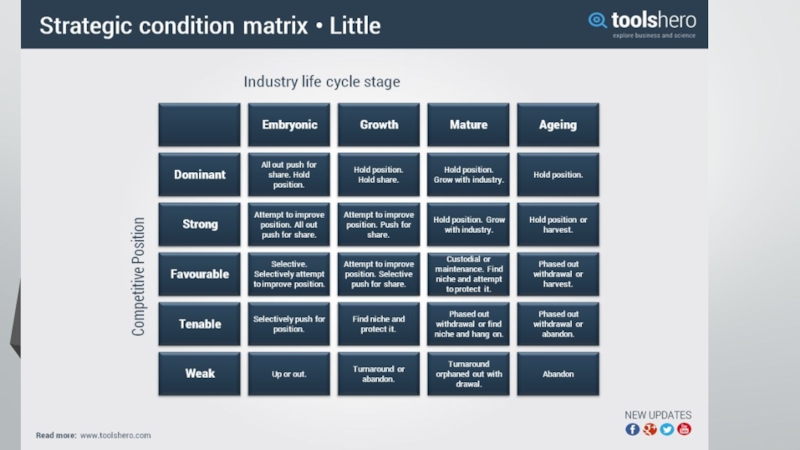
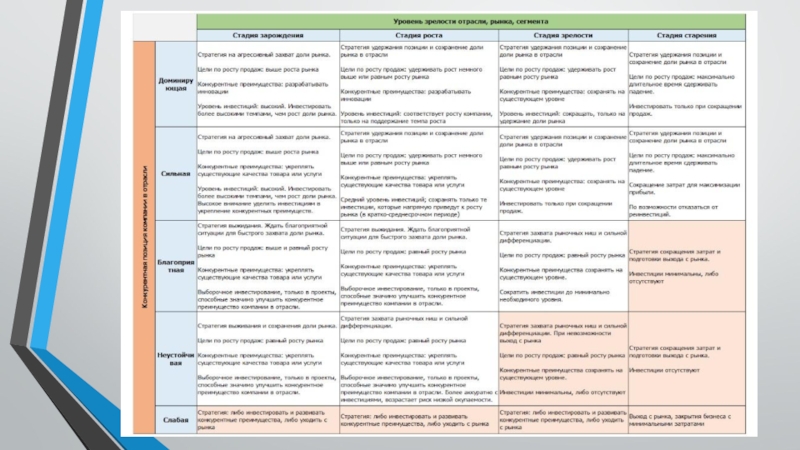
To gain more insight into the competitive position
of organizations, Arthur D. Little developed the strategic condition matrix, which is
also known as the ADL Matrix. The ADL Matrix consists of two important dimensions: the competitive position and industry maturity (maturity of the product).Слайд 21Competitive position
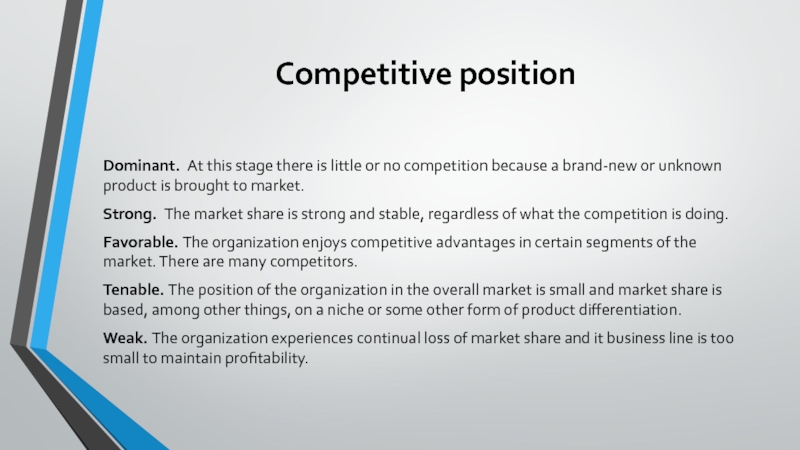
Dominant. At this stage there is little or no
competition because a brand-new or unknown product is brought to
market.Strong. The market share is strong and stable, regardless of what the competition is doing.
Favorable. The organization enjoys competitive advantages in certain segments of the market. There are many competitors.
Tenable. The position of the organization in the overall market is small and market share is based, among other things, on a niche or some other form of product differentiation.
Weak. The organization experiences continual loss of market share and it business line is too small to maintain profitability.
Слайд 22Shell International matrix
This tool is used for strategic analysis and
solving strategic and political issues of the enterprise and is
based on two dimensions: the profitability of the Strategic Economic Zones and the competitive position held by the firm in this strategic zoneСлайд 24business screen McKinsey / GE
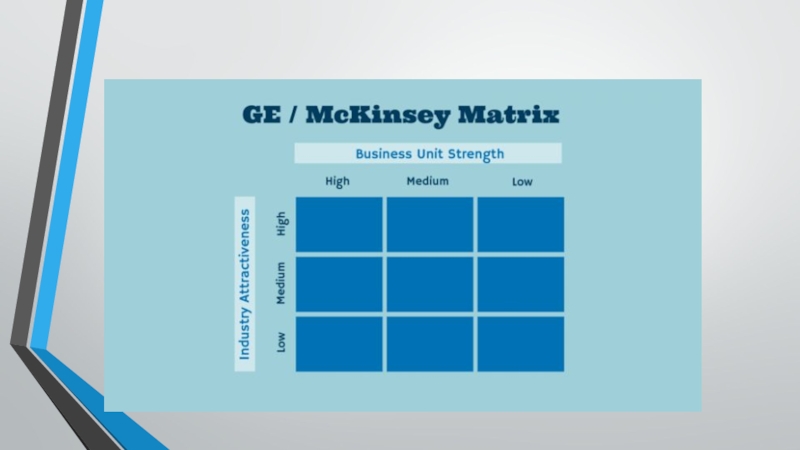
The GE-McKinsey nine-box matrix. A systematic
approach for the multibusiness corporation to prioritize investments among its
business units.It helps multi-business corporations evaluate business portfolios and prioritize investments among different business units in a systematic manner.
This technique is used in brand marketing and product management. The analysis helps companies decide what products need to be added to a product portfolio as well as what other opportunities should continue to receive investments.
Слайд 26Ansoff’s growth strategy matrix
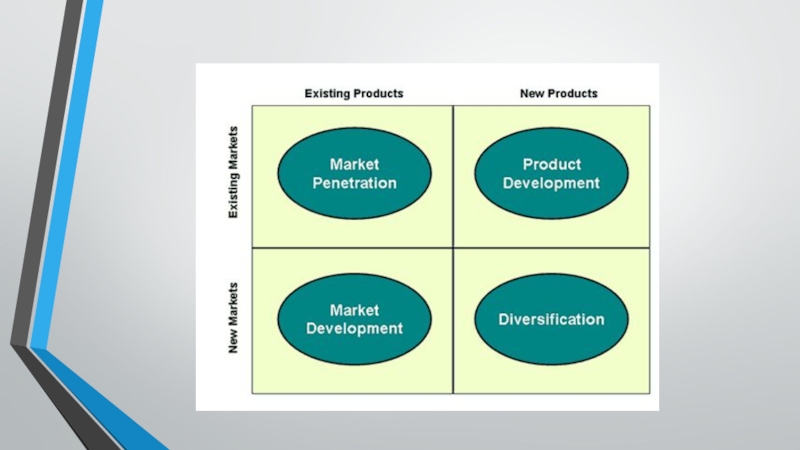
A model that describes possible strategies for
the company's growth in the market.
The matrix is also
called the "commodity-market" matrix.The Ansoff matrix is widely used in practice in the process of strategic enterprise management.
Слайд 28Ansoff's matrix provides four different growth strategies:
Market Penetration - the firm
seeks to achieve growth with existing products in their current
market segments, aiming to increase its market share. Market Development - the firm seeks growth by targeting its existing products to new market segments. Product Development - the firms develops new products targeted to its existing market segments. Diversification - the firm grows by diversifying into new businesses by developing new products for new markets.Слайд 29The analysis model of Michael Porter's five competitive forces
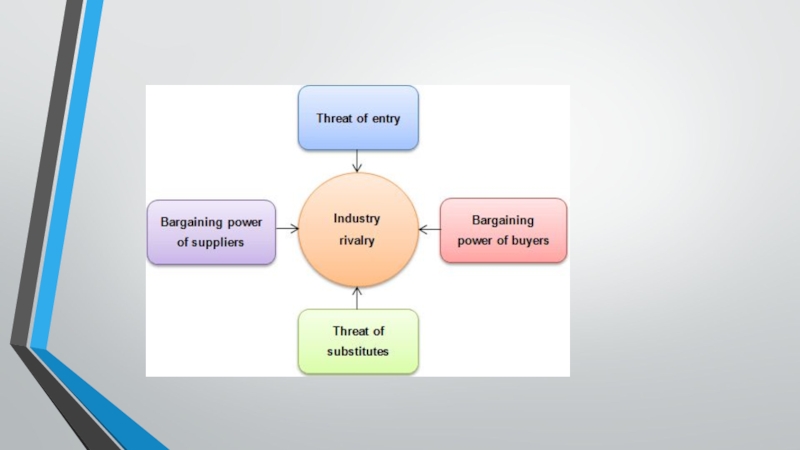
Porter's Five
Forces is a simple but powerful tool for understanding the
competitiveness of your business environment, and for identifying your strategy's potential profitability.Слайд 31Competitive Rivalry. This looks at the number and strength of your
competitors. How many rivals do you have? Who are they,
and how does the quality of their products and services compare with yours?Supplier Power. This is determined by how easy it is for your suppliers to increase their prices. How many potential suppliers do you have? How unique is the product or service that they provide, and how expensive would it be to switch from one supplier to another?
Buyer Power. Here, you ask yourself how easy it is for buyers to drive your prices down. How many buyers are there, and how big are their orders? How much would it cost them to switch from your products and services to those of a rival? Are your buyers strong enough to dictate terms to you?
Threat of Substitution. This refers to the likelihood of your customers finding a different way of doing what you do. For example, if you supply a unique software product that automates an important process, people may substitute it by doing the process manually or by outsourcing it. A substitution that is easy and cheap to make can weaken your position and threaten your profitability.
Threat of New Entry. Your position can be affected by people's ability to enter your market. So, think about how easily this could be done. How easy is it to get a foothold in your industry or market? How much would it cost, and how tightly is your sector regulated?
Слайд 322.3 ANALYSIS OF MARKET SEGMENTS
Segmentation is the process of dividing
potential markets or consumers into specific groups. Market research analysis
using segmentation is a basic component of any marketing effort.Market segmentation is a strategic marketing tool to define markets and then allocating resources appropriately. Using a statistical techniques called factor analysis and cluster analysis combines attitudinal and demographic data.
Слайд 33S-T-P approach
Today, Segmentation, Targeting and Positioning (STP) is a familiar
strategic approach. It is one of the most commonly applied
marketing models in practiceСлайд 35Types of segmentation
1. Demographics (age, gender, income, education, ethnicity, marital
status, education, household (or business), size, length of residence, type
of residence or even profession/Occupation)2. Psychographics. While demographics explain 'who' your buyer is, psychographics inform you 'why' your customer buys
Interviews, Surveys, Customer data,
3. Lifestyle (Hobbies, recreational pursuits, entertainment, vacations, and other non-work time pursuits)
4. Belief and Values (Religious, political, nationalistic and cultural beliefs and values)
5. Life Stages
6. Geography
7. Behaviour (the nature of the purchase, brand loyalty, usage level, benefits sought, distribution channels used, reaction to marketing factors.
8. Benefit is the use and satisfaction gained by the consumer.
Слайд 36The essence is that the company's management will be able
to choose the right segment of the market, where the
company will be able to make the best use of its comparative advantages.Слайд 37Choosing the best segment to operate, the company should develop
a strategy for penetrating this segment.
The enterprise has two
ways. The first is to position the company next to one of the existing competitors and start a fight for market share, the second is to develop a product that is not yet on the market. However, before making such a decision, the company's management must make sure of the availability of technical, economic opportunities and the sufficiency of the number of potential buyers of the proposed product.
Слайд 39Understanding the existing state of the company, the place and
the situation in which it is currently located, would be
incomplete without studying the surrounding competitive environment.Слайд 40Competitive analysis or competitive research is a field of strategic research that specializes
in the collection and review of information about rival firms.
Its an essential tactic for finding out what your competitors are doing and what kind of threat they present to your financial well-being.
Слайд 41How to Conduct Your Competitive Analysis
1. Identify Your Top Ten
Competitors (If you need a little help identifying your competitors,
Google is a great resource.)2. Analyze and Compare Competitor Content
3. Analyze Their SEO Structure
4. Look at their Social Media Integration
5. Identify Areas for Improvement
Слайд 422.5 Positional analysis
The goal of position analysis (or positioning) is
to determine the place occupied by the company, products, brand
in the market in relation to other companies, products, brands and consumers.Positioning is based on the structuring of a set of products or companies based on the perception or preferences of consumers.
Objective similarities and differences of products, brands and companies
The attitude of consumers is more for companies, than real characteristics of product.


