Разделы презентаций
- Разное
- Английский язык
- Астрономия
- Алгебра
- Биология
- География
- Геометрия
- Детские презентации
- Информатика
- История
- Литература
- Математика
- Медицина
- Менеджмент
- Музыка
- МХК
- Немецкий язык
- ОБЖ
- Обществознание
- Окружающий мир
- Педагогика
- Русский язык
- Технология
- Физика
- Философия
- Химия
- Шаблоны, картинки для презентаций
- Экология
- Экономика
- Юриспруденция
Seminar 3 Introduction to backtesting : case of naïve 1/N strategy
Содержание
- 1. Seminar 3 Introduction to backtesting : case of naïve 1/N strategy
- 2. Satisfying vs optimalSimple rules are often far
- 3. Simplicity in portfolio theory“One should always divide
- 4. Steps of strategy evaluationFormally define rules for
- 5. Decision-making rulesDistribute your initial capital equally between
- 6. Not so simple in factHow to choose
- 7. Universe of securitiesWe will look at largest
- 8. Data collectionWe need daily close prices for
- 9. Simulate trading process
- 10. Compare result with the benchmark
- 11. RebalancingValues of the allocations change in timeEventually
- 12. Backtest pitfallsSurvivorship biaswe picked only companies that
- 13. Скачать презентанцию
Satisfying vs optimalSimple rules are often far more robust than complicated ”optimal” alternativesRules of thumb work surprisingly well in a variety of fields (Haldane, 2012)Reasons:“collecting and processing the information necessary for
Слайды и текст этой презентации
Слайд 1Seminar 3
Introduction to backtesting: case of naïve 1/N strategy
Mikhail Kamrotov
Data
Analysis in Economics and Finance
Слайд 2Satisfying vs optimal
Simple rules are often far more robust than
complicated ”optimal” alternatives
Rules of thumb work surprisingly well in a
variety of fields (Haldane, 2012)Reasons:
“collecting and processing the information necessary for complex decision-making is costly”
“fully defining future states of the world, and probability‑weighting them, is beyond anyone’s cognitive limits”
Oversimplifying things is obviously bad as well
Слайд 3Simplicity in portfolio theory
“One should always divide his wealth into
three parts: a third in land, a third in merchandise,
and a third ready to hand.”Source: Rabbi Isaac bar Aha, Babylonian Talmud: Tractate Baba Mezi’a, folio 42a, 4th century
Empirically valid statement
Naïve, equal-weight portfolio frequently delivers better results than “optimal” allocation strategies (DeMiguel, 2005)
Let’s test this simple allocation strategy!
Слайд 4Steps of strategy evaluation
Formally define rules for decision-making
Collect data and
clean it
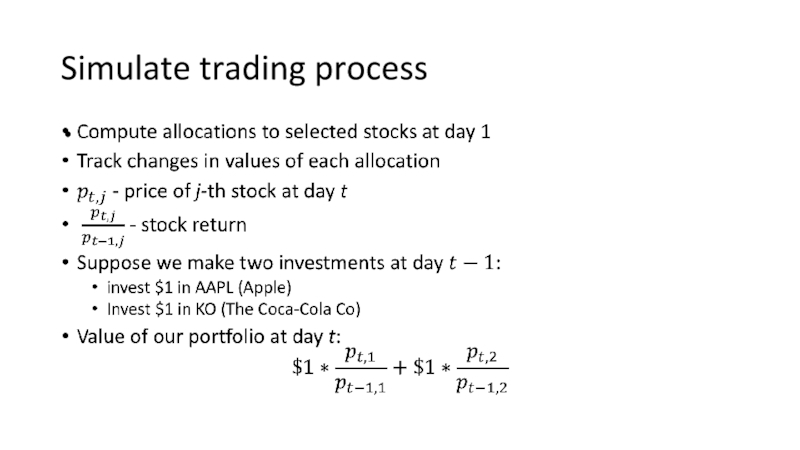
Simulate trading process
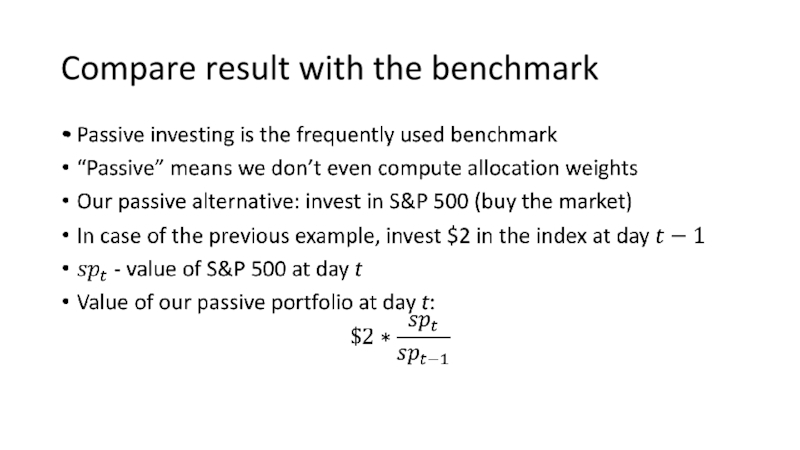
Compare the results to the benchmark
Compute performance
metricsСлайд 5Decision-making rules
Distribute your initial capital equally between N stocks
Wait
Example:
Initial capital:
$1000
10 stocks
You invest $100 in each stock and stay away
from the market for a whileLooks simple!
Слайд 6Not so simple in fact
How to choose N stocks (assets)
to invest in?
Infinite possible solutions:
All US stocks
All stocks in the
worldAll stocks, bonds, currencies, real estate – everything
Only stocks that satisfy specific conditions (most liquid stocks, stocks of the largest companies, stocks with low P/E ratio, etc.)
Result crucially depends on the answer
Universe of securities is a set of stocks (assets) you’re focusing on
Слайд 7Universe of securities
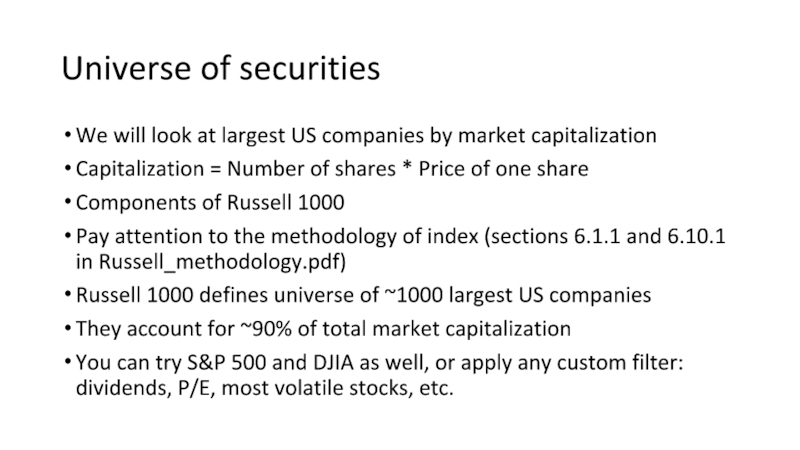
We will look at largest US companies by
market capitalization
Capitalization = Number of shares * Price of one
shareComponents of Russell 1000
Pay attention to the methodology of index (sections 6.1.1 and 6.10.1 in Russell_methodology.pdf)
Russell 1000 defines universe of ~1000 largest US companies
They account for ~90% of total market capitalization
You can try S&P 500 and DJIA as well, or apply any custom filter: dividends, P/E, most volatile stocks, etc.
Слайд 8Data collection
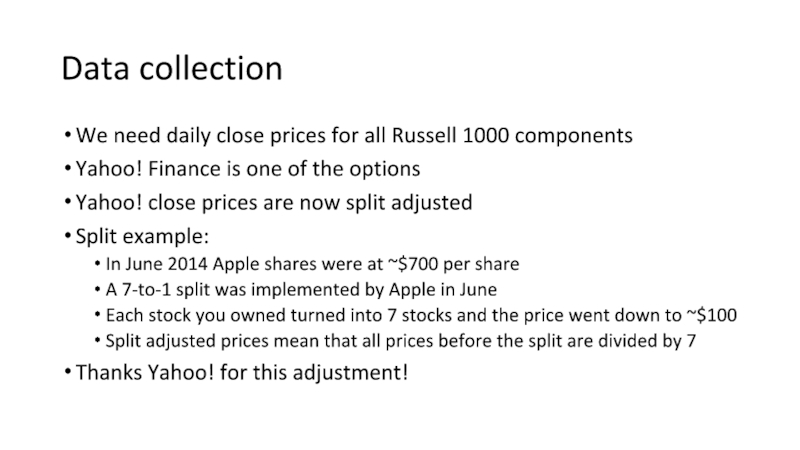
We need daily close prices for all Russell 1000
components
Yahoo! Finance is one of the options
Yahoo! close prices are
now split adjustedSplit example:
In June 2014 Apple shares were at ~$700 per share
A 7-to-1 split was implemented by Apple in June
Each stock you owned turned into 7 stocks and the price went down to ~$100
Split adjusted prices mean that all prices before the split are divided by 7
Thanks Yahoo! for this adjustment!
Слайд 11Rebalancing
Values of the allocations change in time
Eventually the portfolio becomes
imbalanced
Periodic rebalancing is needed
daily
weekly
monthly
by any specific rule
Source: https://hackernoon.com
Слайд 12Backtest pitfalls
Survivorship bias
we picked only companies that didn’t go bankrupt
moreover,
they were eventually included in Russell 1000 – we picked
the best onesNo trading costs
Trading on close prices is impossible
Stocks are not sold in fractions
And many more pitfalls which we will discuss later
See “A Practitioner’s Guide to Assessing Strategies and Avoiding Pitfalls” and chapter 3 of “Successful Algorithmic Trading” (M. Halls-Moore, 2015) for advanced details
