Разделы презентаций
- Разное
- Английский язык
- Астрономия
- Алгебра
- Биология
- География
- Геометрия
- Детские презентации
- Информатика
- История
- Литература
- Математика
- Медицина
- Менеджмент
- Музыка
- МХК
- Немецкий язык
- ОБЖ
- Обществознание
- Окружающий мир
- Педагогика
- Русский язык
- Технология
- Физика
- Философия
- Химия
- Шаблоны, картинки для презентаций
- Экология
- Экономика
- Юриспруденция
UML Basics
Содержание
- 1. UML Basics
- 2. AgendaUML in Telelogic Tau G2 First stepsIntroduction
- 3. Important ReferencesTelelogic Tau G2 user’s documentationThe UML
- 4. Main questions• Why choose UML 2.0 to
- 5. Tau G2 diagram classification
- 6. Types of main diagramsUsecase diagram - Describes
- 7. Types of main diagramsSequence diagram - Describes
- 8. Types of additional diagramsPackage diagram - A
- 9. Types of additional diagramsComponent diagram - A
- 10. Use Case DiagramsUse Case: a view of
- 11. Use Case Diagrams: core elements
- 12. Use Case Diagrams: core elements
- 13. Use Case Diagrams: example
- 14. Architecture diagramsIn the Standard it’s refered to
- 15. Architecture Diagrams: core elements
- 16. Architecture diagram: example
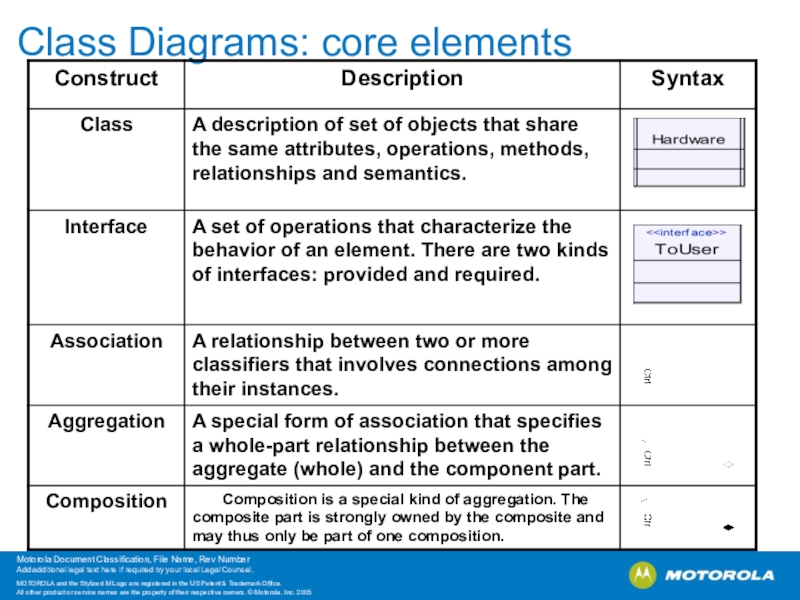
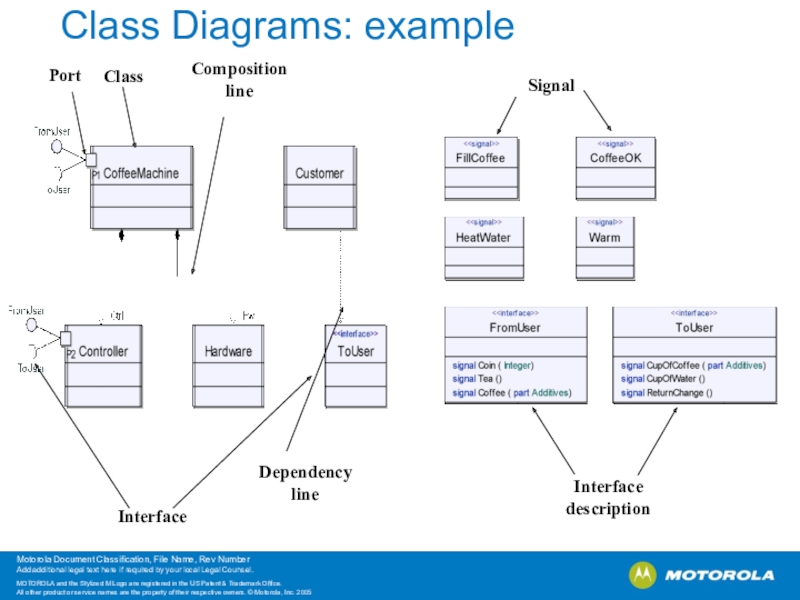
- 17. Class DiagramsClass: a description of a set
- 18. Class Diagrams: core elements
- 19. Class Diagrams: core elements
- 20. Class Diagrams: example
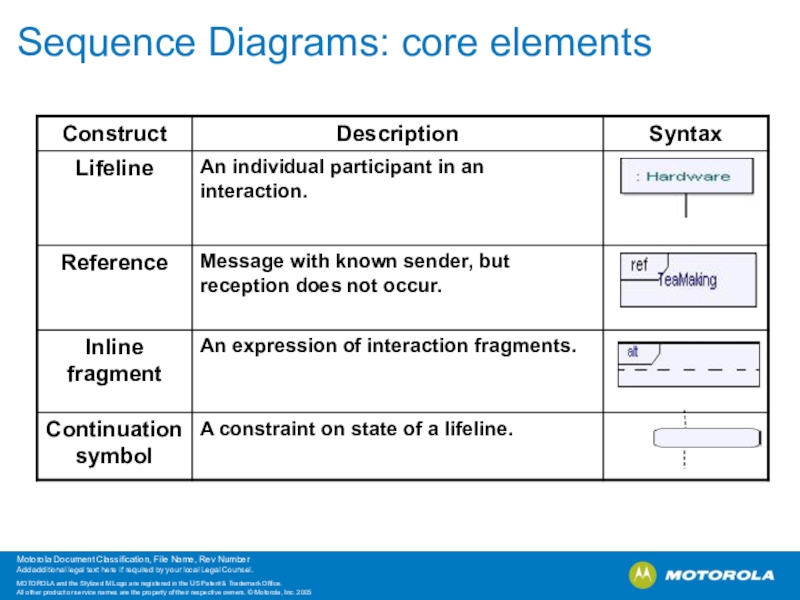
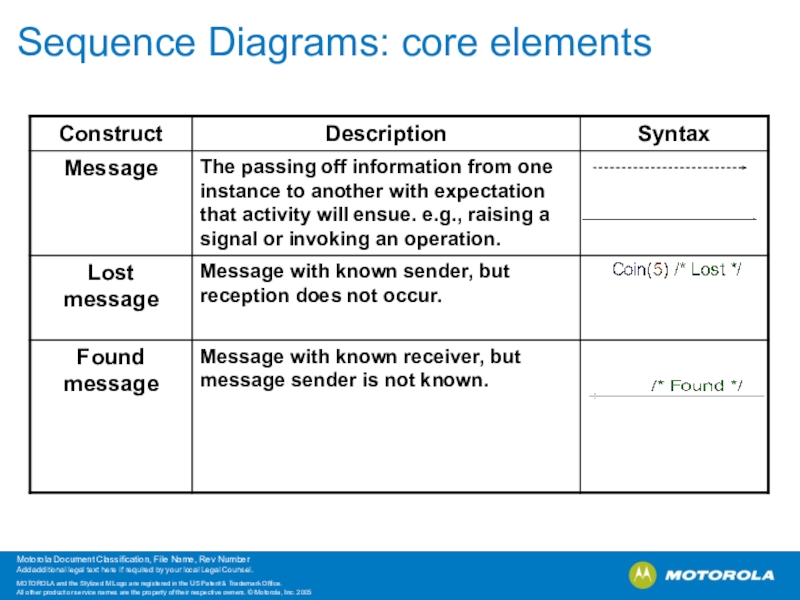
- 21. Sequence DiagramsDescribes the sequence of events in
- 22. Sequence Diagrams: core elements
- 23. Sequence Diagrams: core elements
- 24. Sequence Diagrams: exampleReference
- 25. State Chart DiagramsUML State Machines exhibit the
- 26. State Chart Diagrams: core elements
- 27. State Chart Diagrams: example
- 28. Transition vs. State Oriented Syntax
- 29. Text DiagramsThe graphical form of the UML
- 30. Text Diagrams: exampleOperation
- 31. Package Diagrams A Package allows definitions to be
- 32. Package Diagrams: core elements
- 33. Package Diagrams: example
- 34. Interaction Overview DiagramsInteraction Overview Diagrams are a
- 35. Interaction Overview Diagrams: example
- 36. Activity DiagramsActivity Diagram shows behavior using a
- 37. Activity Diagrams: core elements
- 38. Activity diagrams: example
- 39. Diagrams usage Requirements Architecture Design Use-Case Diagram
- 40. From SDL to UML
- 41. From SDL to UML
- 42. From SDL to UML
- 43. From SDL to UML
- 44. Training Project
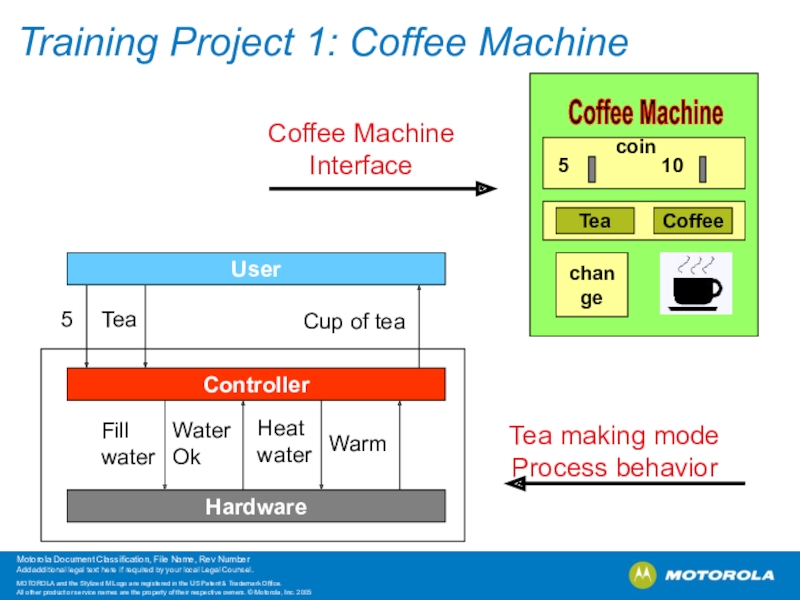
- 45. Training Project 1: Coffee Machine
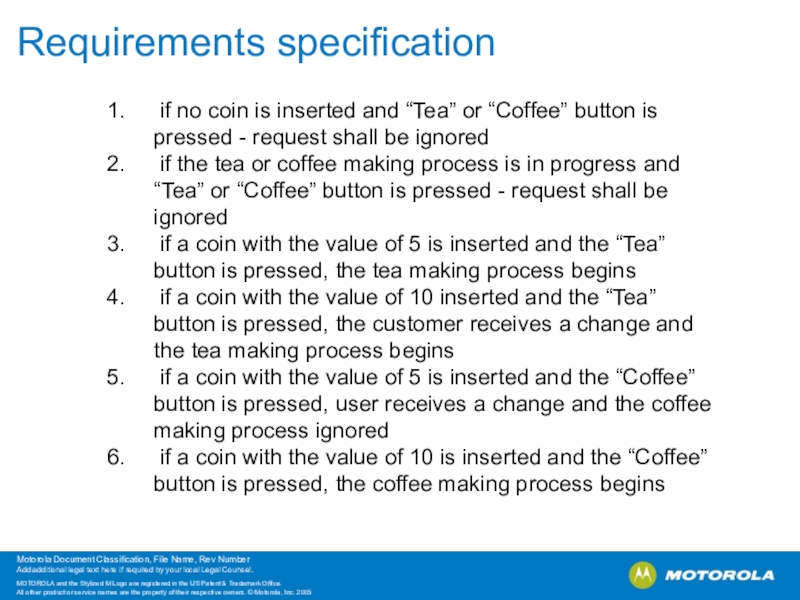
- 46. if no coin is inserted and
- 47. Simple tutorial
- 48. Thank YOU
- 49. Скачать презентанцию
AgendaUML in Telelogic Tau G2 First stepsIntroduction in LanguageTelelogic Tau and G2 compatibility (SDL/MSC to UML)Project exampleCoffee Machine
Слайды и текст этой презентации
Слайд 2Agenda
UML in Telelogic Tau G2
First steps
Introduction in Language
Telelogic Tau
and G2 compatibility (SDL/MSC to UML)
Слайд 3Important References
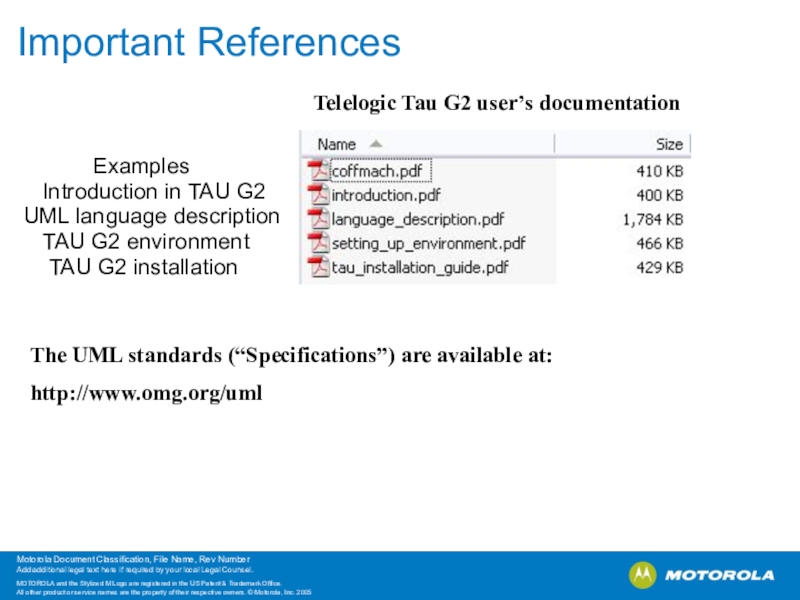
Telelogic Tau G2 user’s documentation
The UML standards (“Specifications”) are
available at:
http://www.omg.org/uml
Examples
Introduction in TAU G2
UML language description
TAU G2 environment
TAU G2
installationСлайд 4Main questions
• Why choose UML 2.0 to visualize information?
It provides
a single, standardized, powerful language for precisely describing
systems design and
software design, which can be interchanged with otherUML 2.0 users.
• How cans UML 2.0 help create effective solutions?
It gives systems engineers a way to visually define the information they want
to describe, such as architecture, interfaces, and functional requirements.
However, this visual description is more than pictures; it is precise and can be
automatically checked.
• How does UML 2.0 help manage technical complexity?
It gives systems engineers the means to visually describe technically complex
information, in ways which reflect the development process, completely
specify the behavior of complex systems and can be tested during design creation.
• How else cans UML 2.0 help systems engineers?
It increases reuse within and between projects, through reuse of design
components, and as a reusable common language between systems engineers
and software developers and testers.
Слайд 6Types of main diagrams
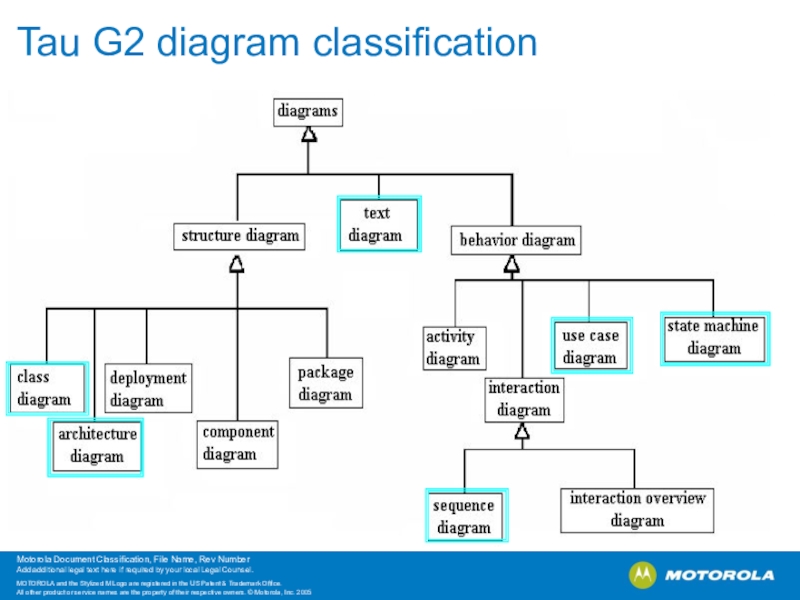
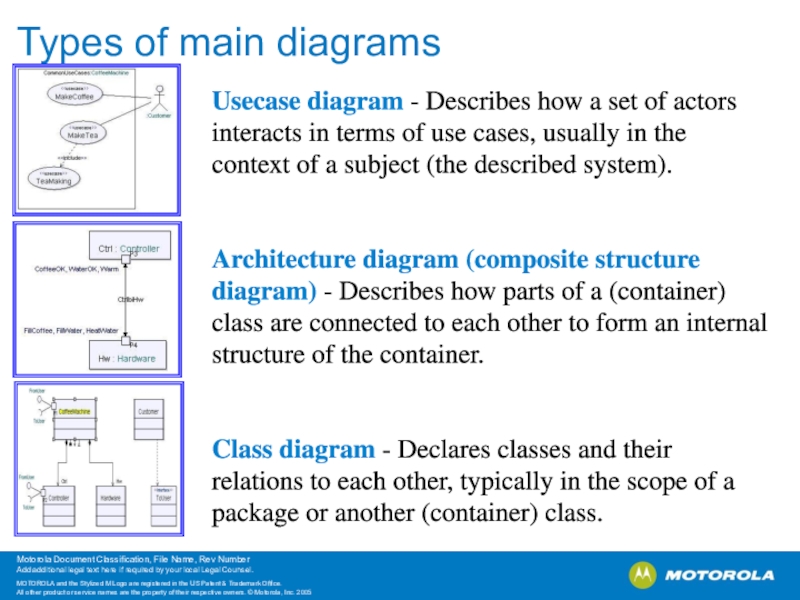
Usecase diagram - Describes how a set
of actors interacts in terms of use cases, usually in
the context of a subject (the described system).Architecture diagram (composite structure diagram) - Describes how parts of a (container) class are connected to each other to form an internal structure of the container.
Class diagram - Declares classes and their relations to each other, typically in the scope of a package or another (container) class.
Слайд 7Types of main diagrams
Sequence diagram - Describes the event sequence
for a use case or an operation.
State Chart Diagram -
Defines the behavior of classes, state machines and operations.Text diagram - Defines an entity textually (textual stubs)
Слайд 8Types of additional diagrams
Package diagram - A package diagram contains
presentation elements and their relations. Package diagrams can exist in
packages and classes.Interaction Overview diagram - An interaction overview diagram describes some form of parallel behavior. It is often used to describe a use case.
Activity diagram - An activity diagram can show parallel and intertwined behavior. This may allow a simplified view of a complex structure where it is possible to focus on a specific flow of control.
Слайд 9Types of additional diagrams
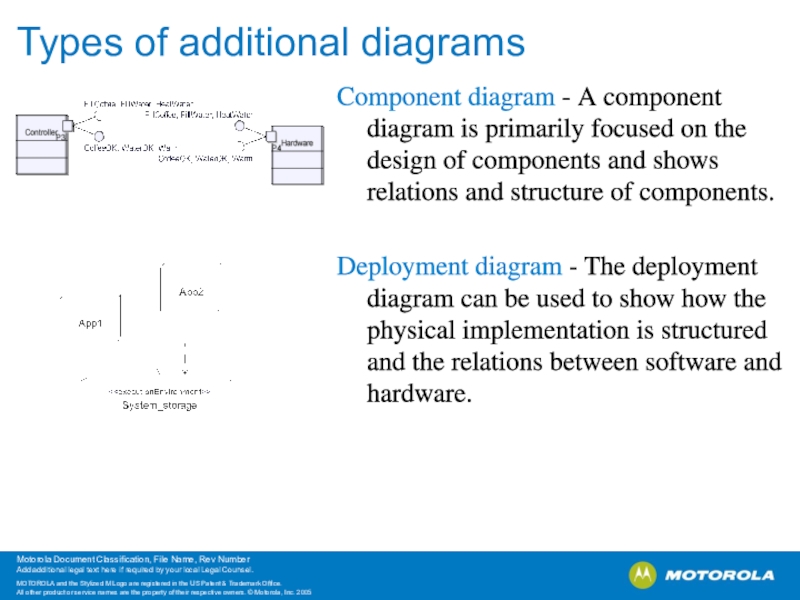
Component diagram - A component diagram is
primarily focused on the design of components and shows relations
and structure of components.Deployment diagram - The deployment diagram can be used to show how the physical implementation is structured and the relations between software and hardware.
Слайд 10Use Case Diagrams
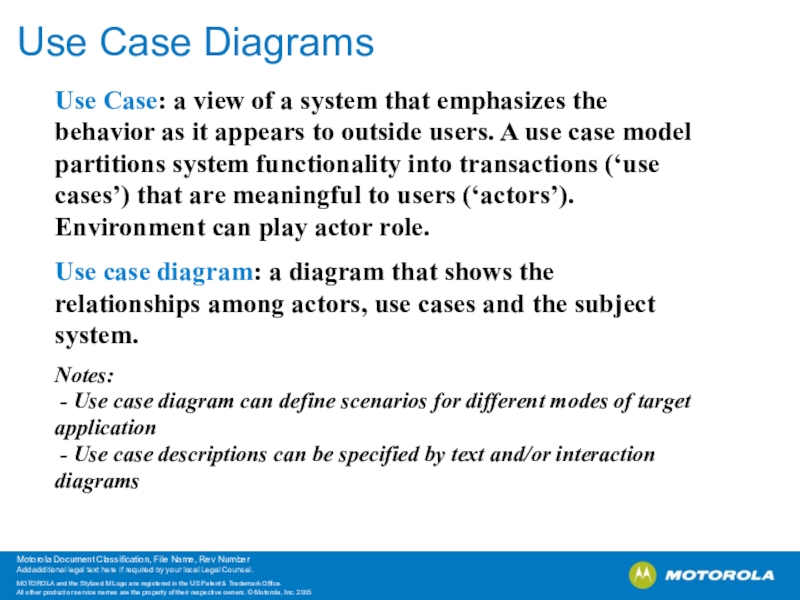
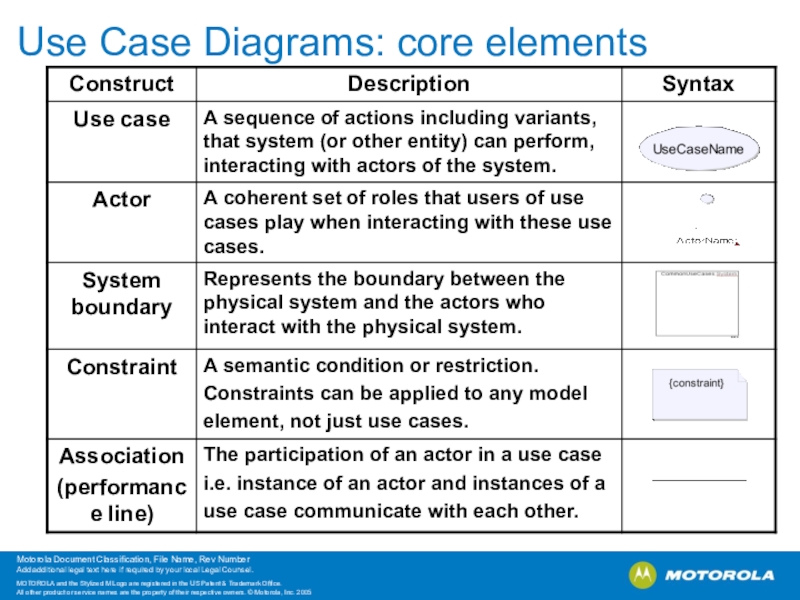
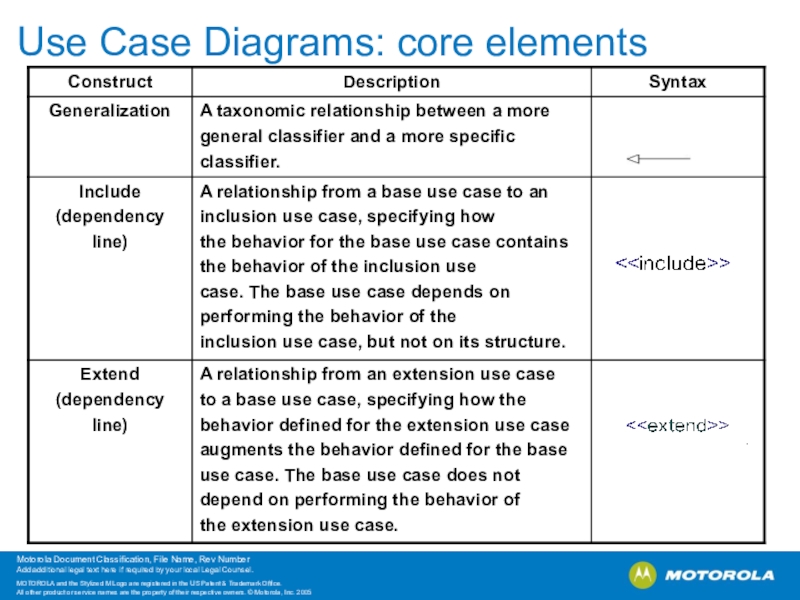
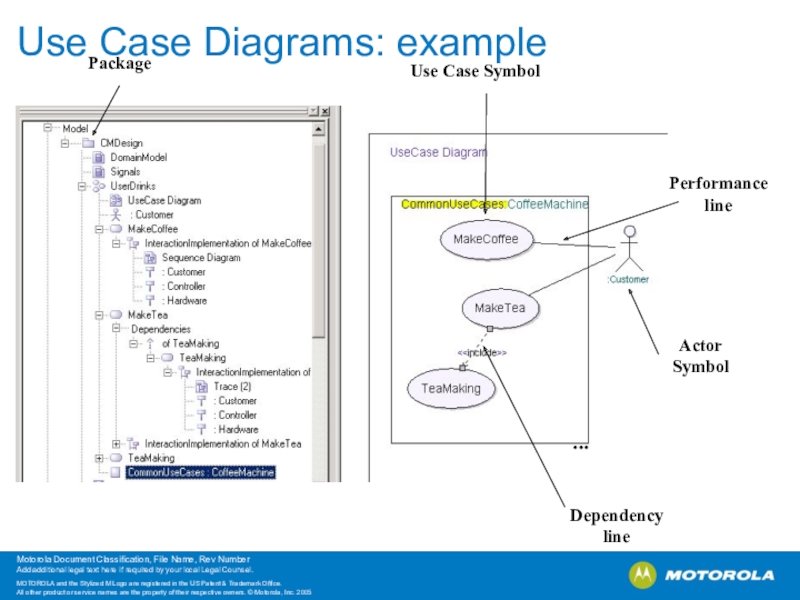
Use Case: a view of a system that
emphasizes the behavior as it appears to outside users. A
use case model partitions system functionality into transactions (‘use cases’) that are meaningful to users (‘actors’). Environment can play actor role.Use case diagram: a diagram that shows the relationships among actors, use cases and the subject system.
Notes: - Use case diagram can define scenarios for different modes of target application - Use case descriptions can be specified by text and/or interaction diagrams
Слайд 14Architecture diagrams
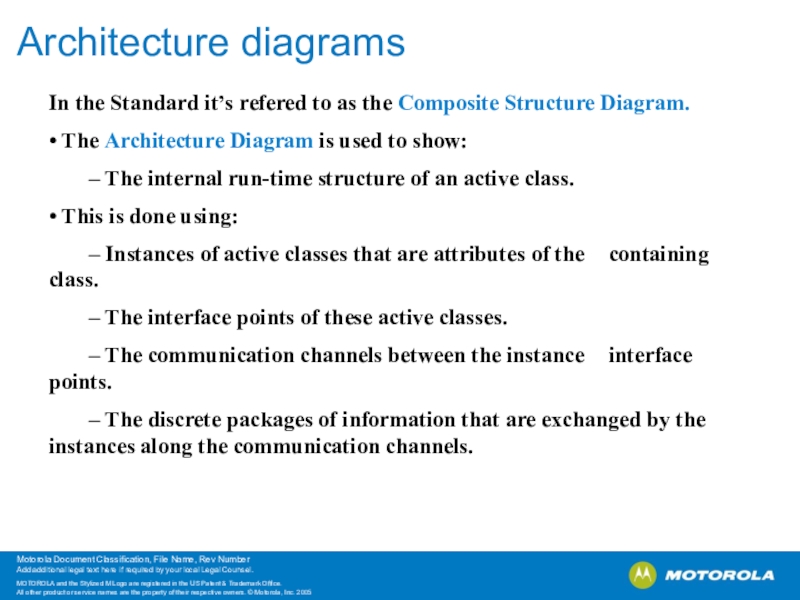
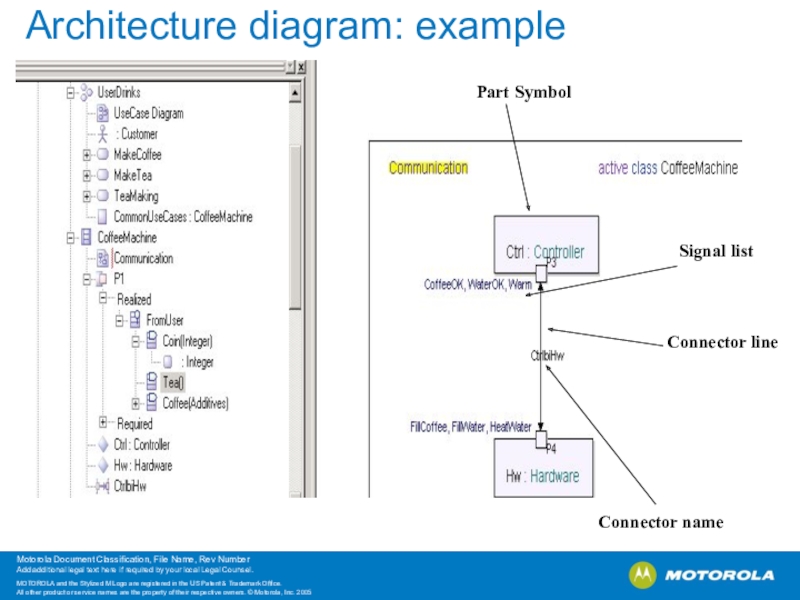
In the Standard it’s refered to as the Composite
Structure Diagram.
• The Architecture Diagram is used to show:
– The
internal run-time structure of an active class.• This is done using:
– Instances of active classes that are attributes of the containing class.
– The interface points of these active classes.
– The communication channels between the instance interface points.
– The discrete packages of information that are exchanged by the instances along the communication channels.
Слайд 17Class Diagrams
Class: a description of a set of objects that
share the same attributes, operations, methods, relations and semantics.
Class diagram:
A diagram that shows a collection of declarative (static) model elements, such as classes, types and their contents and relationships.Class diagram should:
Emphasize a particular of the structural model
Contain classes at the same level of abstraction
Слайд 21Sequence Diagrams
Describes the sequence of events in an easy-to-understand format
for
capturing requirements, design, traces, test cases and test suites
A Sequence Diagram is a variant of an Interaction Diagram.
It consists of a set of entities and the Messages that are communicated
among them.
A Sequence Diagram focuses on the time ordering (sequence) of the
interchanged Messages.
Слайд 25State Chart Diagrams
UML State Machines exhibit the characteristics of a
Mealy-type machine, where the output depends on both the present
state and the inputs.• It normally sits waiting in a State until an Event occurs, usually the reception of a Signal.
• If the received Signal is not somehow explicitly handled by the current
State, then the Signal is discarded, i.e., thrown away.
• If the Signal can be handled by the current State, then
– the Signal is “consumed”
– the corresponding Transition is taken
– any actions (including outputs) are executed
– the State Machine enters its Nextstate.
Слайд 29Text Diagrams
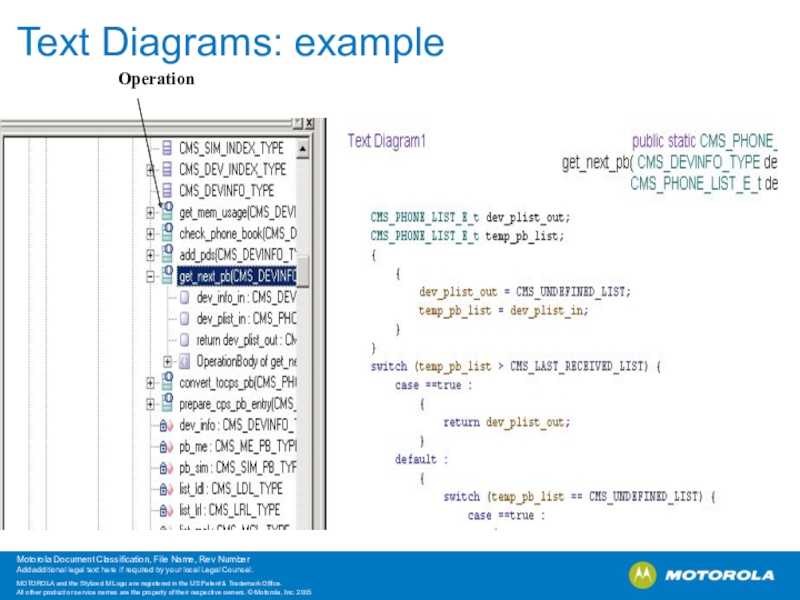
The graphical form of the UML is unwieldy when
trying to describe advanced algorithms.
Capturing such functionality in textual form
provides a concise way of describing them.– Easier to read
– More comprehensible
– More maintainable
– Significant savings in diagram size (page Real Estate)
Слайд 31Package Diagrams
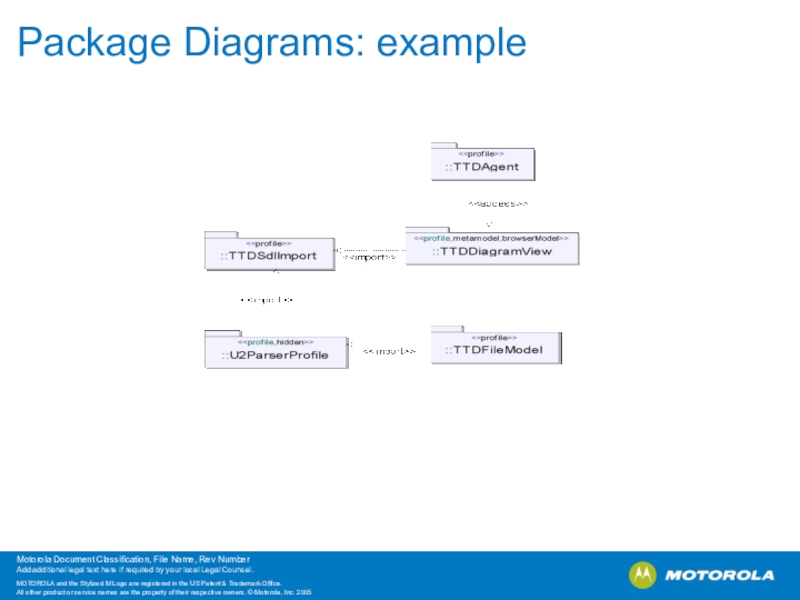
A Package allows definitions to be shared by several
different entities.
• A Package defines a new scope unit (namespace).
•
A Package is normally used to organize elements into groups.– It can also contain other Packages.
• Packages allow control of visibility and access rights to their elements.
– Better compartmentalization.
– Decreased coupling.
• Everything in UML is ultimately contained in one Package or another.
Слайд 34Interaction Overview Diagrams
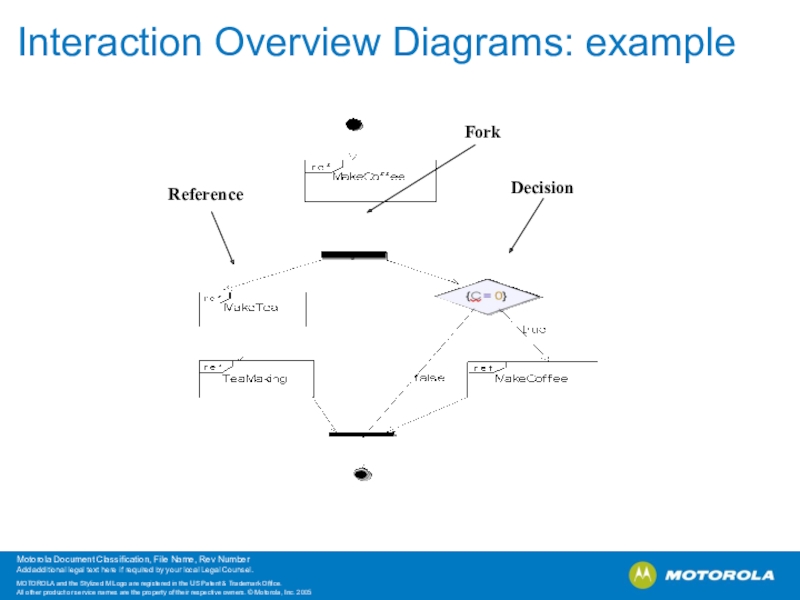
Interaction Overview Diagrams are a variant of Activity
Diagrams that define interactions in a way that promotes overview
of the control flow.Interactions focus on the communications between instances, using message passing to express operation invocation and signal sending
Interactions are used
during analysis, to improve individual or group understanding ofinter-object behavior
during design, to precisely describe inter-process communication
during testing, the traces can be compared with those described in the earlier phases.
Слайд 36Activity Diagrams
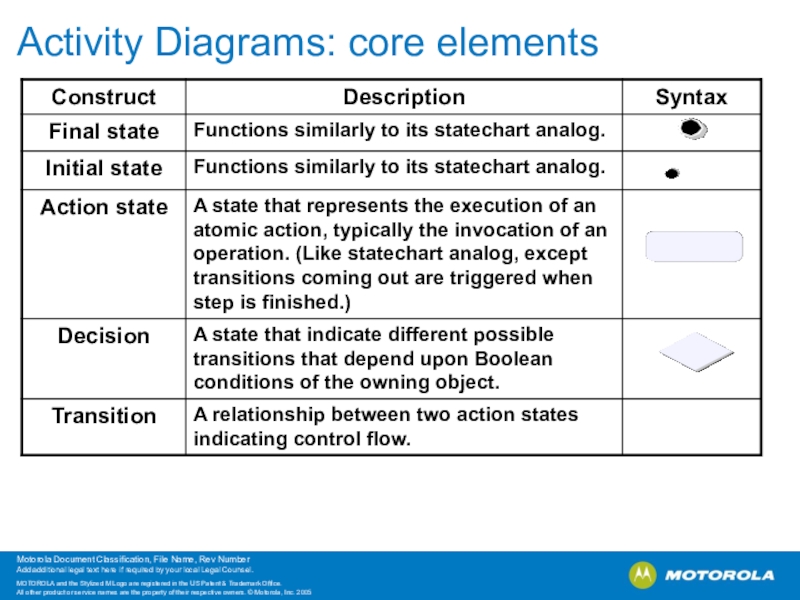
Activity Diagram shows behavior using a control and data
flow
Activity modeling emphasizes the sequence and conditions for
coordinating other
behaviors, using secondary constructs to show whichclassifiers are responsible for those behaviors.
Typical applications of Interactions include:
– process modeling (business, physical)
– workflow modeling
– requirements
Слайд 39Diagrams usage
Requirements Architecture Design
Use-Case Diagram +
+ +
Sequence Diagram
+ + +Interaction Overview Diagram + + +
Activity Diagram + +
State Machine Diagram + +
Class Diagram + + +
Component Diagram +
Deployment Diagram +
Package Diagram + + +
Слайд 46 if no coin is inserted and “Tea” or “Coffee”
button is pressed - request shall be ignored
if the
tea or coffee making process is in progress and “Tea” or “Coffee” button is pressed - request shall be ignoredif a coin with the value of 5 is inserted and the “Tea” button is pressed, the tea making process begins
if a coin with the value of 10 inserted and the “Tea” button is pressed, the customer receives a change and the tea making process begins
if a coin with the value of 5 is inserted and the “Coffee” button is pressed, user receives a change and the coffee making process ignored
if a coin with the value of 10 is inserted and the “Coffee” button is pressed, the coffee making process begins
Requirements specification
