Слайд 1«Бәсекелес фирманың пайданы көбейтуі және ұсыныс қисығы»
Слайд 2Сонымен, жетілген бәсекелестік жағдайда фирма пайдасының көбеюі тек қана өндіріс
(ұсыныс) көлемін таңдаумен байланысты.
Өндірістің қандай көлемі фирмаға ең
жоғары пайданы қамтамасыз етеді?
Пайданы көбейтудің 2 қағидасы белгілі:
1) Жалпы табыс пен жалпы шығындарды салыстыру қағидасы.
2) Шекті табыс пен шекті шығындарды салыстыру қағидасы.
Слайд 3Фирма пайдасының көбею шарты:
шекті табыс пен шекті шығындардың теңдігі сақталатын
өндіріс көлемі. Фирма пайдасын көбейту ережесі кез келген нарықта әрекетте
болуы мүмкін, бірақ оның өз ерекшеліктері бар.
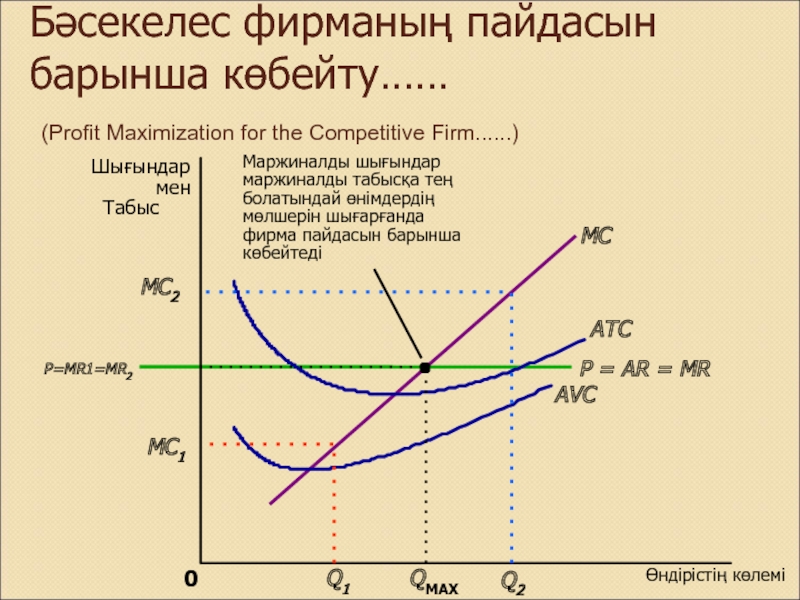
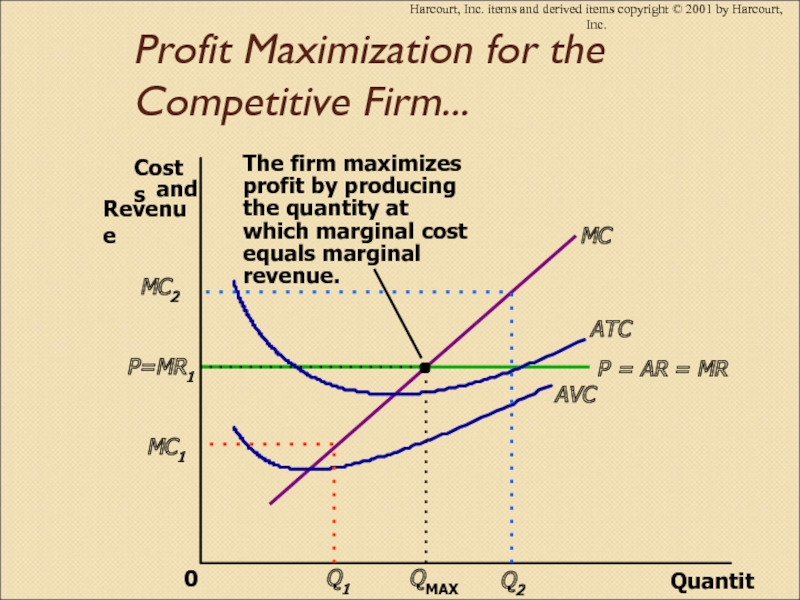
Слайд 4Бәсекелес фирманың пайдасын барынша көбейту……
(Profit Maximization for the Competitive
Firm......)
Өндірістің көлемі
0
ATC
AVC
Слайд 5Бәсекелес фирманың пайдасын барынша көбейту
(Profit Maximization for the Competitive Firm)
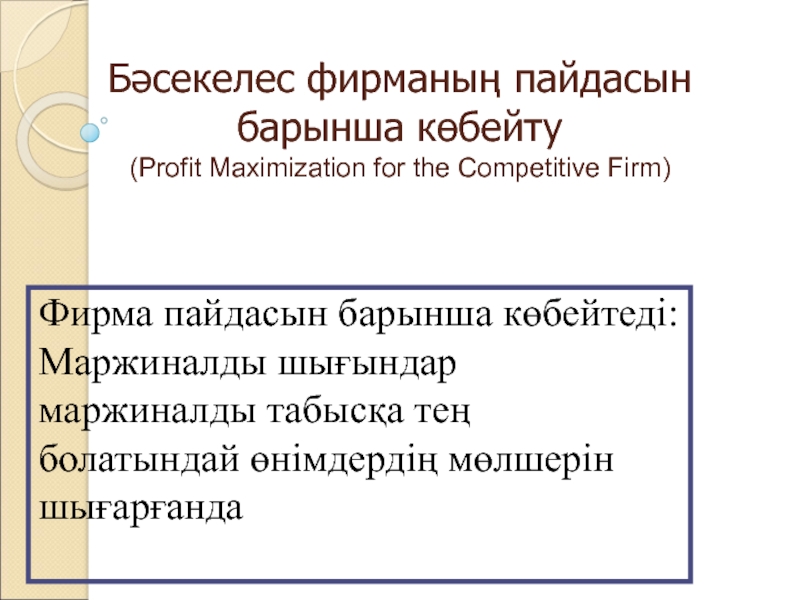
Фирма
пайдасын барынша көбейтеді: Маржиналды шығындар маржиналды табысқа тең болатындай өнімдердің
мөлшерін шығарғанда
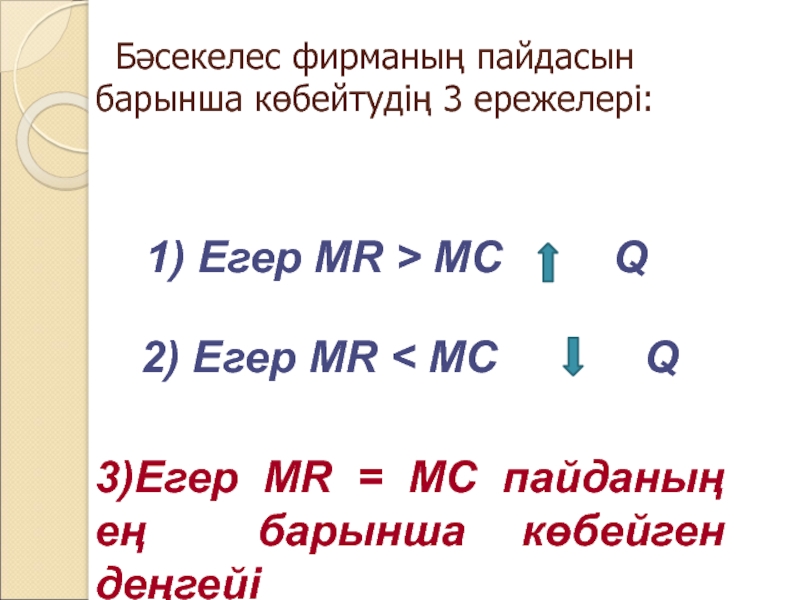
Слайд 6Бәсекелес фирманың пайдасын барынша көбейтудің 3 ережелері:
1) Егер MR >
MC Q
2) Егер MR < MC
Q
3)Егер MR = MC пайданың ең барынша көбейген деңгейі
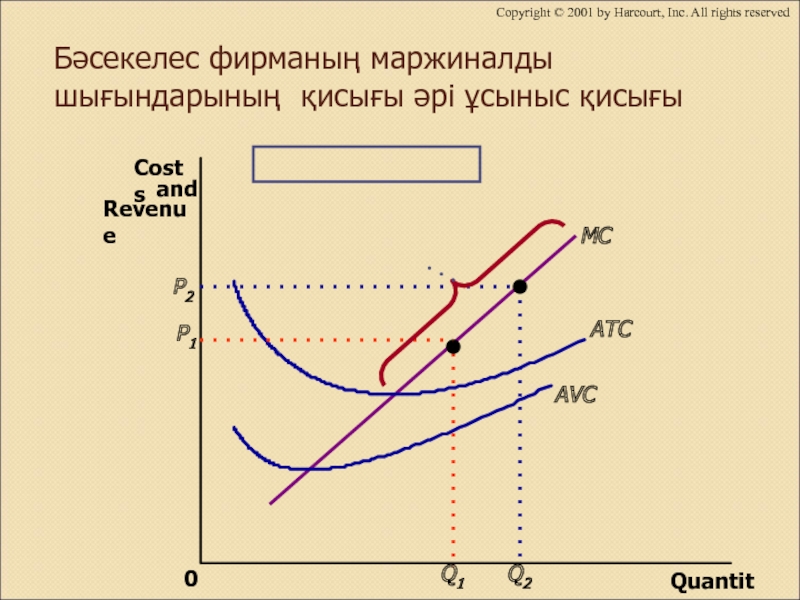
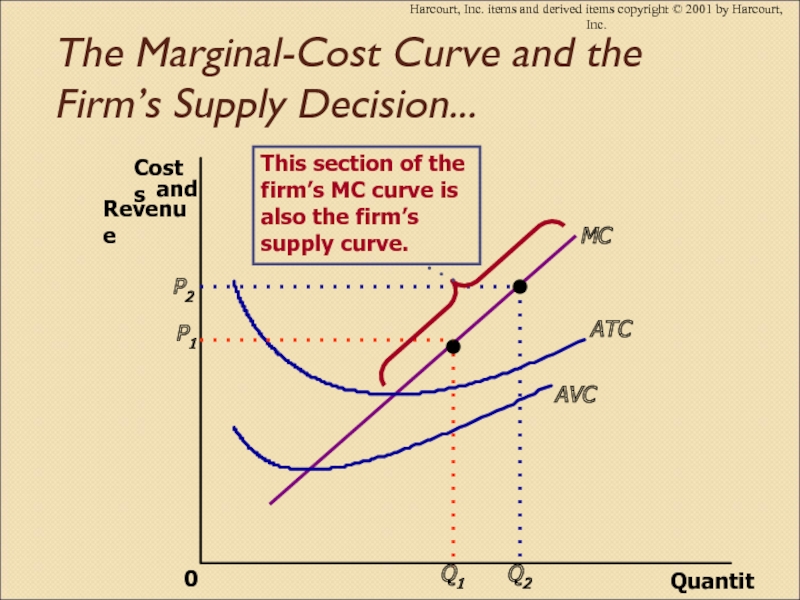
Слайд 7Бәсекелес фирманың маржиналды шығындарының қисығы әрі ұсыныс қисығы
Quantity
0
MC
ATC
AVC
Copyright © 2001
by Harcourt, Inc. All rights reserved
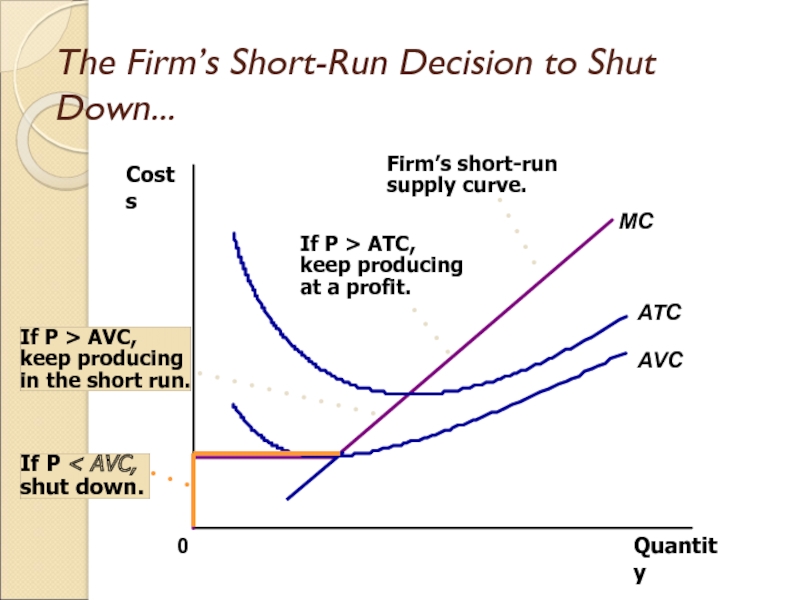
Слайд 8Фирманың өндірісті қысқа мерзімге тоқтату туралы шешімі
(The Firm’s Short-Run Decision
to Shut Down)
Өндірісті уақытша тоқтату нарықтағы қалыптасқан жағдайға байланысты
қысқа мерзімде белгілі бір уақытқа өнім өндіруд тоқтату.
Нарықтан шығу фирманың нарықтан ұзақ мерзімге кетеді.
Слайд 9Фирманың өндірісті қысқа мерзімге тоқтату туралы шешімі
(The Firm’s Short-Run Decision
to Shut Down)
Фирма қысқа мерзімге өнім шығаруды тоқтатады, егер
фирманың өндірістік әрекеті әкелетін табыс өндірістің айнымалы шығындарынан аз болатын болса.
Слайд 10Фирманың өндірісті қысқа мерзімге тоқтату туралы шешімі:
Егер TR (жалпы табыс)
< VC(өзгермелі шығындар)- өндірісті қысқа мерзімге тоқтату туралы шешім қабылданады;
Егер TR/Q < VC/Q (TR/Q=жалпы табысты / өндірістің көлеміне = фирманың орташа табысы= Р(өнімнің бағасы); VC/Q= орташа өзгермелі шығындар AVC) -өндірісті қысқа мерзімге тоқтату туралы шешім қабылданады;
Сондықтан фирма өндірісті қысқа мерзімге тоқтатуға шешім қабылдайды:
P(баға) < AVC(орташа өзгермелі шығындар )
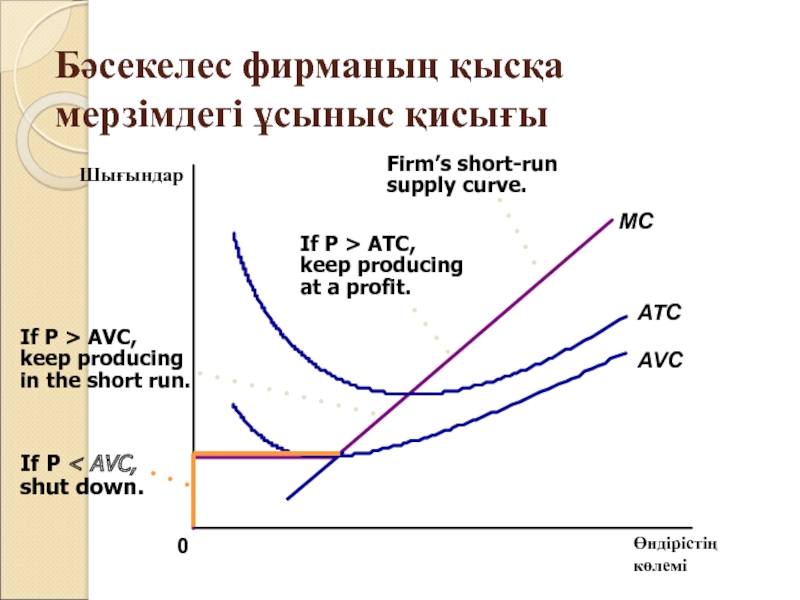
Слайд 11Бәсекелес фирманың қысқа мерзімдегі ұсыныс қисығы
Өндірістің
көлемі
ATC
AVC
0
Шығындар
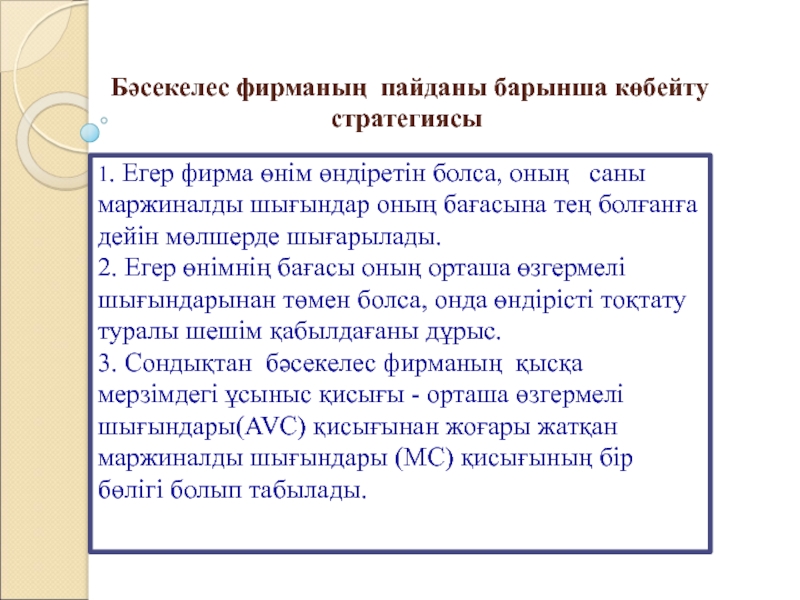
Слайд 12 Бәсекелес фирманың пайданы барынша көбейту стратегиясы
1. Егер фирма өнім
өндіретін болса, оның саны маржиналды шығындар оның бағасына тең
болғанға дейін мөлшерде шығарылады.
2. Егер өнімнің бағасы оның орташа өзгермелі шығындарынан төмен болса, онда өндірісті тоқтату туралы шешім қабылдағаны дұрыс.
3. Сондықтан бәсекелес фирманың қысқа мерзімдегі ұсыныс қисығы - орташа өзгермелі шығындары(AVC) қисығынан жоғары жатқан маржиналды шығындары (МС) қисығының бір бөлігі болып табылады.
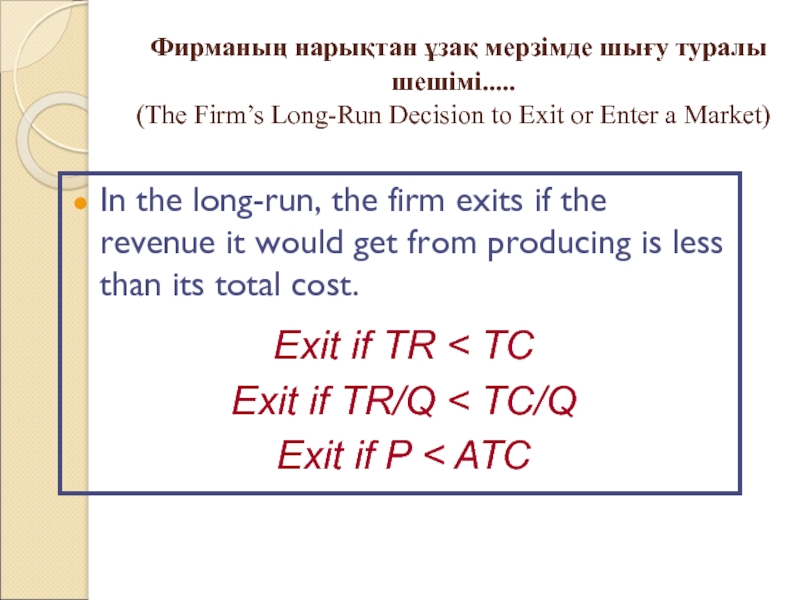
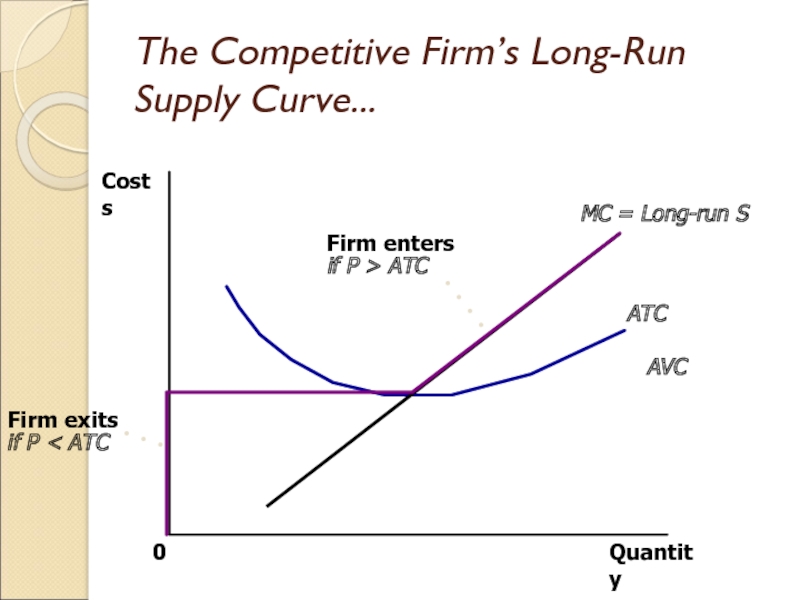
Слайд 13 Фирманың нарықтан ұзақ мерзімде шығу туралы шешімі.....
(The Firm’s Long-Run
Decision to Exit or Enter a Market)
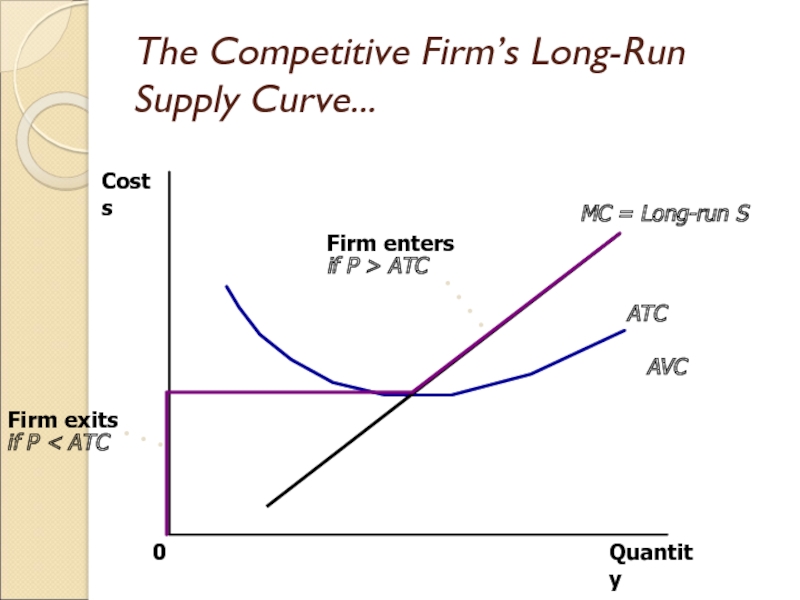
In the long-run, the
firm exits if the revenue it would get from producing is less than its total cost.
Exit if TR < TC
Exit if TR/Q < TC/Q
Exit if P < ATC
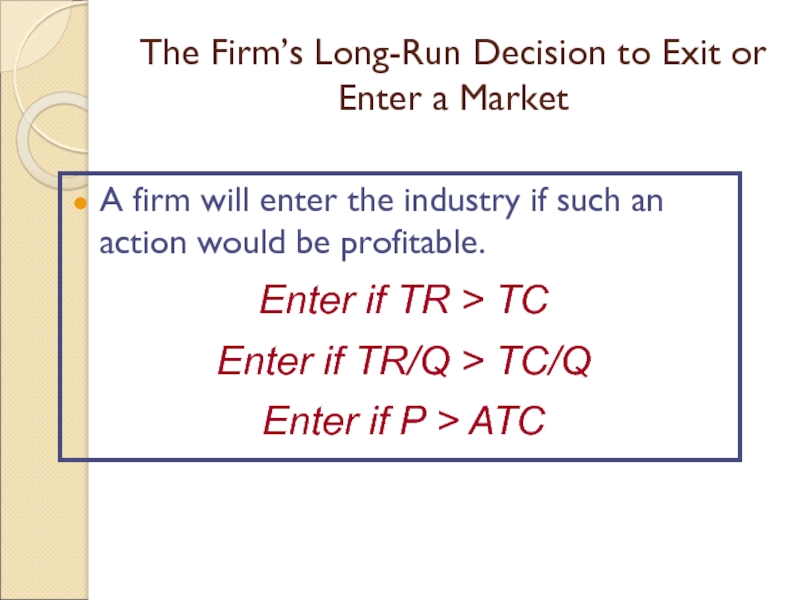
Слайд 14The Firm’s Long-Run Decision to Exit or Enter a Market
A
firm will enter the industry if such an action would
be profitable.
Enter if TR > TC
Enter if TR/Q > TC/Q
Enter if P > ATC
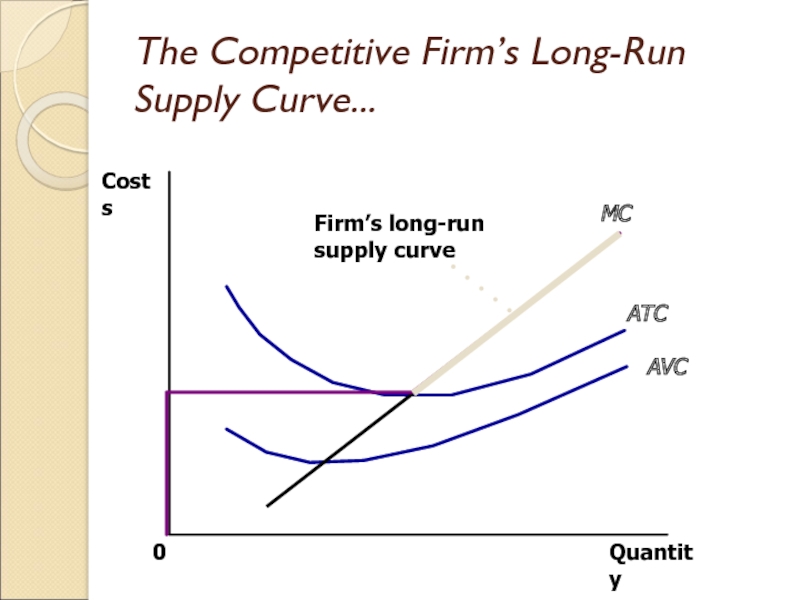
Слайд 15The Competitive Firm’s Long-Run Supply Curve...
Quantity
MC = Long-run S
ATC
AVC
0
Costs
Слайд 16The Competitive Firm’s Long-Run Supply Curve
The competitive firm’s long-run supply
curve is the portion of its marginal-cost curve that lies
above average total cost.
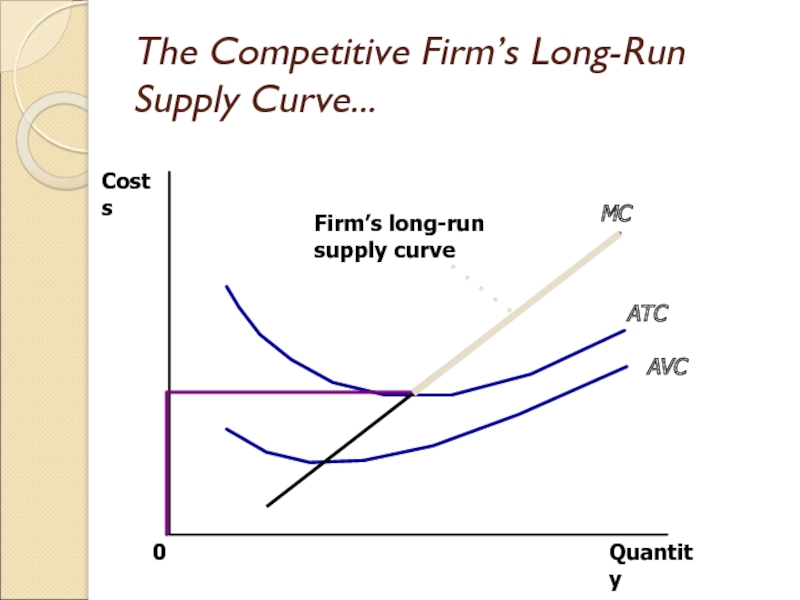
Слайд 17The Competitive Firm’s Long-Run Supply Curve...
Quantity
MC
ATC
AVC
0
Costs
Слайд 18The Firm’s Short-Run and Long-Run Supply Curves
Short-Run Supply Curve
The portion
of its marginal cost curve that lies above average variable
cost.
Long-Run Supply Curve
The marginal cost curve above the minimum point of its average total cost curve.
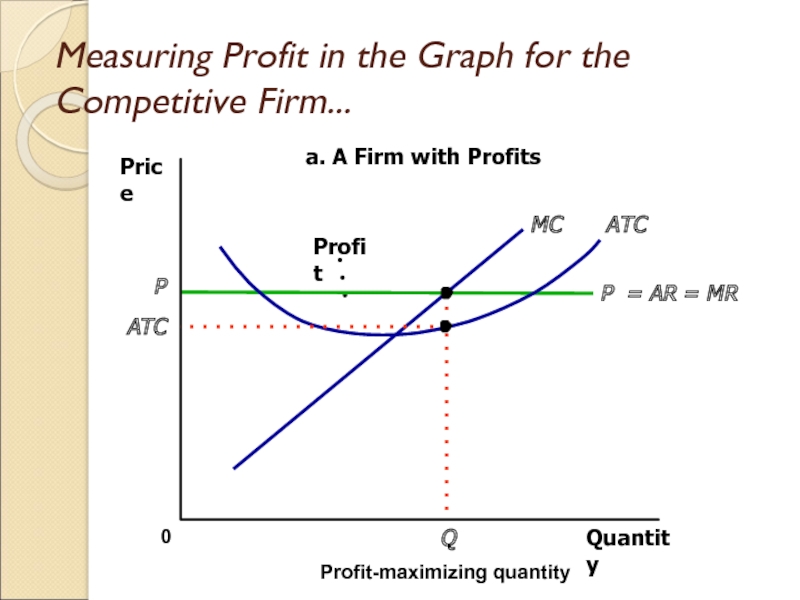
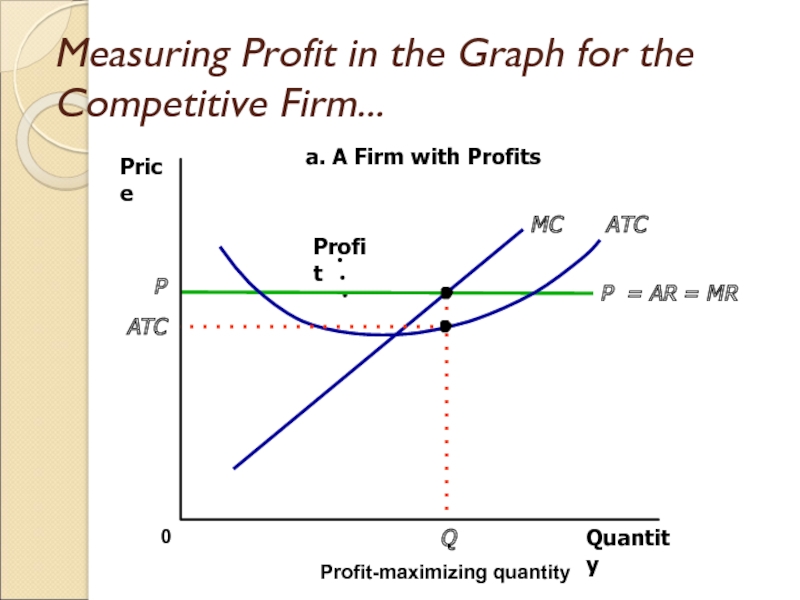
Слайд 19Measuring Profit in the Graph for the Competitive Firm...
Quantity
0
Price
P =
AR = MR
ATC
MC
P
Profit-maximizing quantity
a. A Firm with Profits
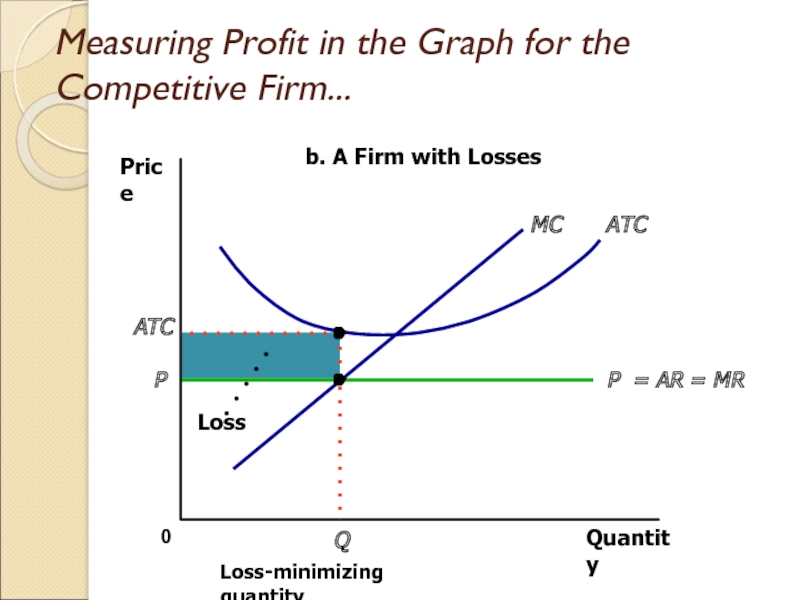
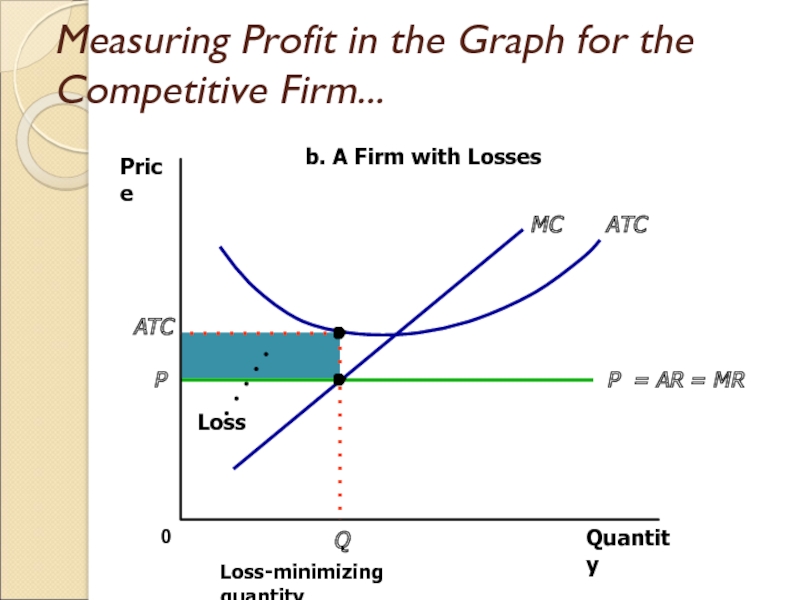
Слайд 20Measuring Profit in the Graph for the Competitive Firm...
Quantity
0
Price
P =
AR = MR
ATC
MC
P
Q
Loss-minimizing quantity
b. A Firm with Losses
Слайд 21Supply in a Competitive Market
Market supply equals the sum of
the quantities supplied by the individual firms in the market.
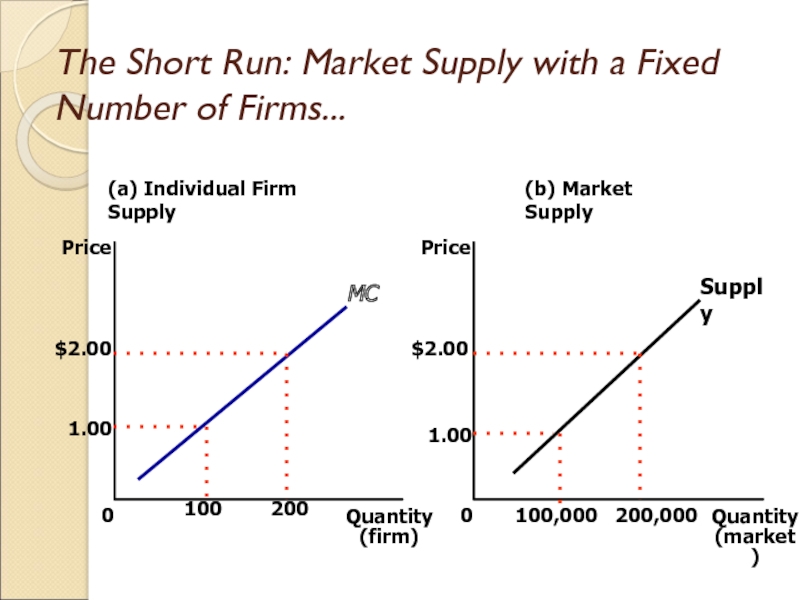
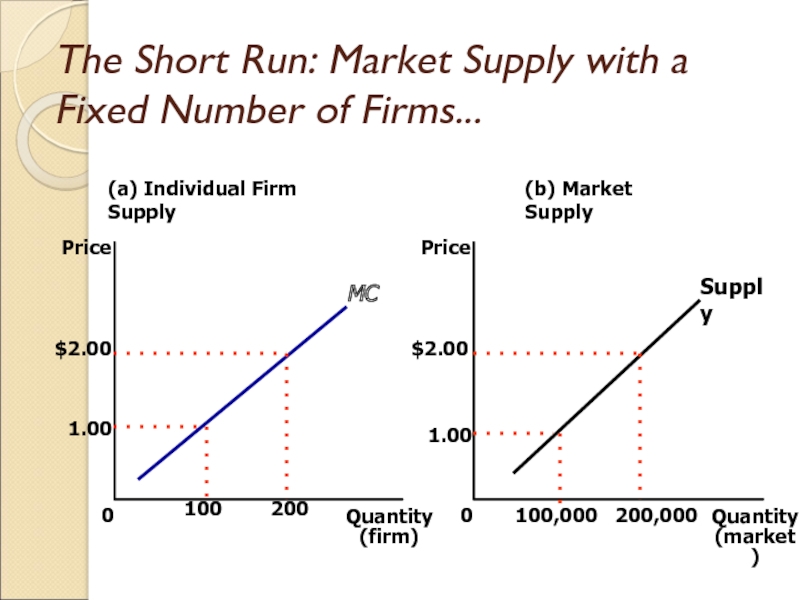
Слайд 22The Short Run: Market Supply with a Fixed Number of
Firms
For any given price, each firm supplies a quantity of
output so that its marginal cost equals price.
The market supply curve reflects the individual firms’ marginal cost curves.
Слайд 23The Short Run: Market Supply with a Fixed Number of
Firms...
(a) Individual Firm Supply
Quantity
(firm)
0
Price
(b) Market Supply
Quantity
(market)
Price
0
Supply
MC
1.00
$2.00
100
200
1.00
$2.00
100,000
200,000
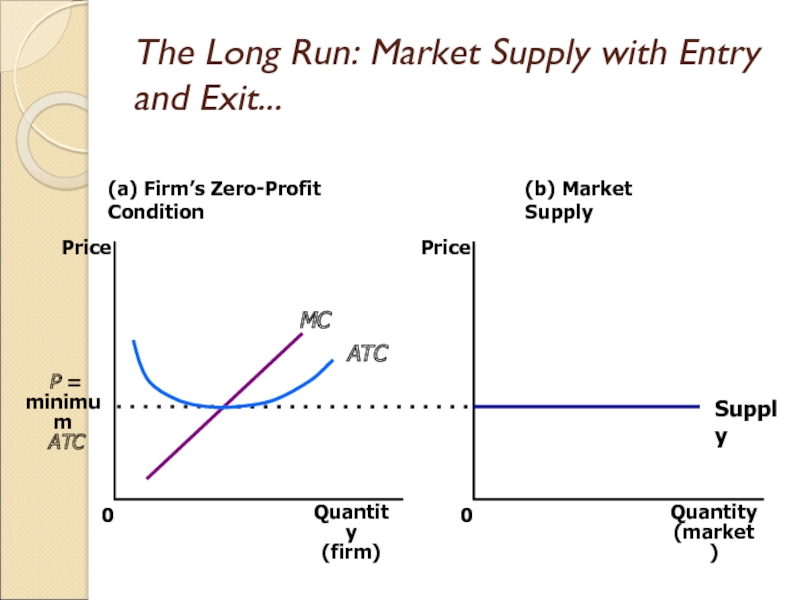
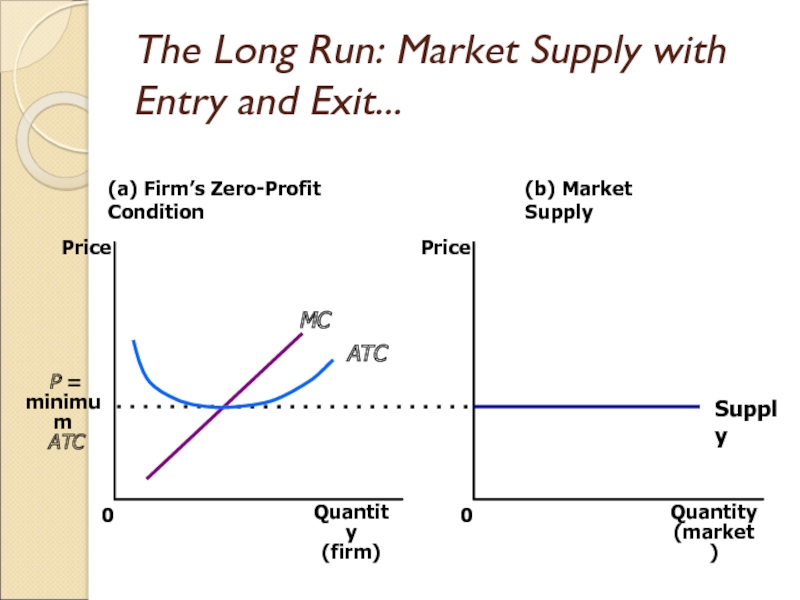
Слайд 24The Long Run: Market Supply with Entry and Exit
Firms will
enter or exit the market until profit is driven to
zero.
In the long run, price equals the minimum of average total cost.
The long-run market supply curve is horizontal at this price.
Слайд 25The Long Run: Market Supply with Entry and Exit...
(a) Firm’s
Zero-Profit Condition
Quantity
(firm)
0
Price
P =
minimum
ATC
(b) Market Supply
Quantity
(market)
Price
0
Supply
MC
ATC
Слайд 26The Long Run: Market Supply with Entry and Exit
At the
end of the process of entry and exit, firms that
remain must be making zero economic profit.
The process of entry & exit ends only when price and average total cost are driven to equality.
Long-run equilibrium must have firms operating at their efficient scale.
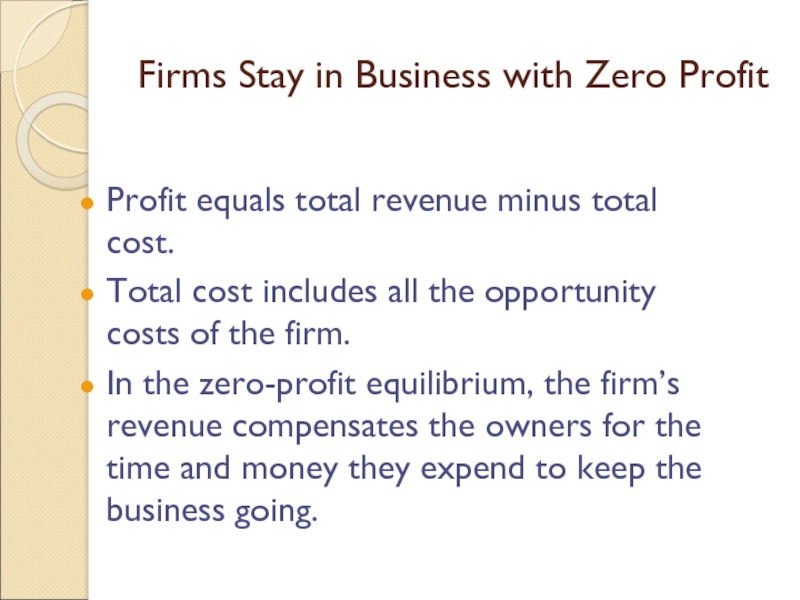
Слайд 27Firms Stay in Business with Zero Profit
Profit equals total revenue
minus total cost.
Total cost includes all the opportunity costs of
the firm.
In the zero-profit equilibrium, the firm’s revenue compensates the owners for the time and money they expend to keep the business going.
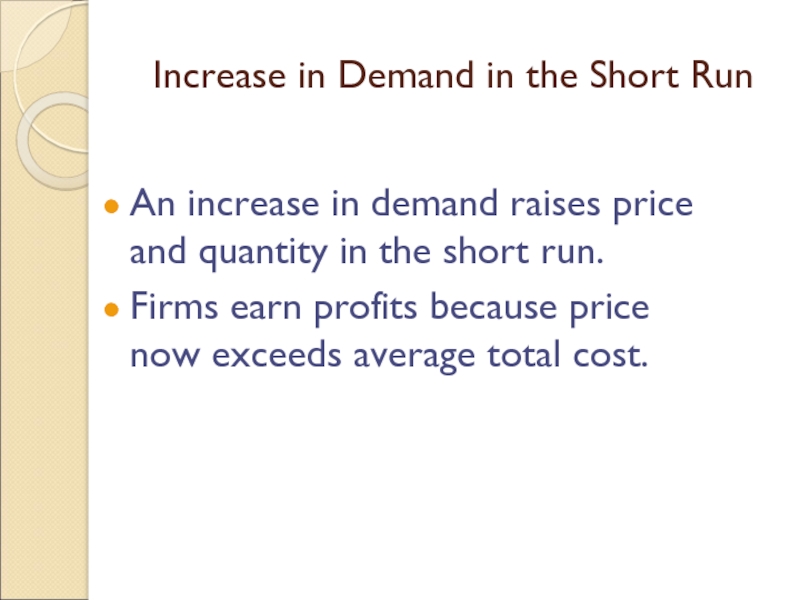
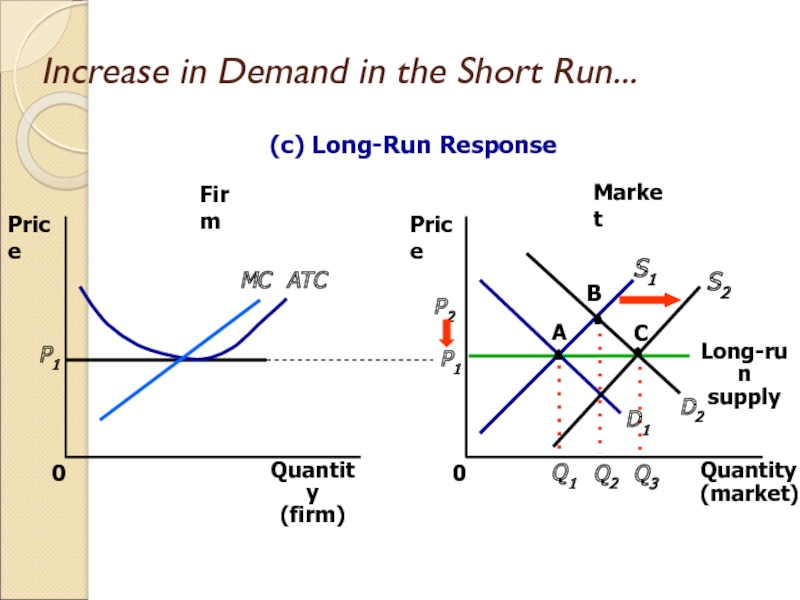
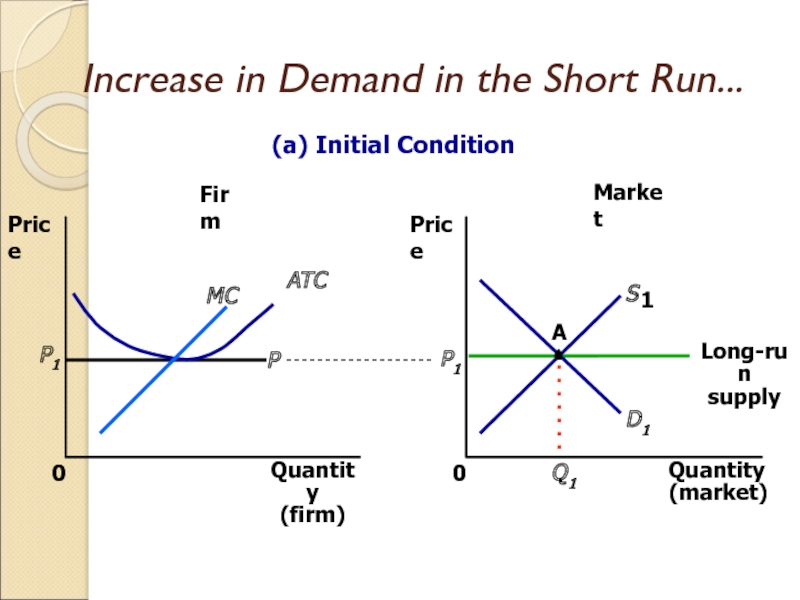
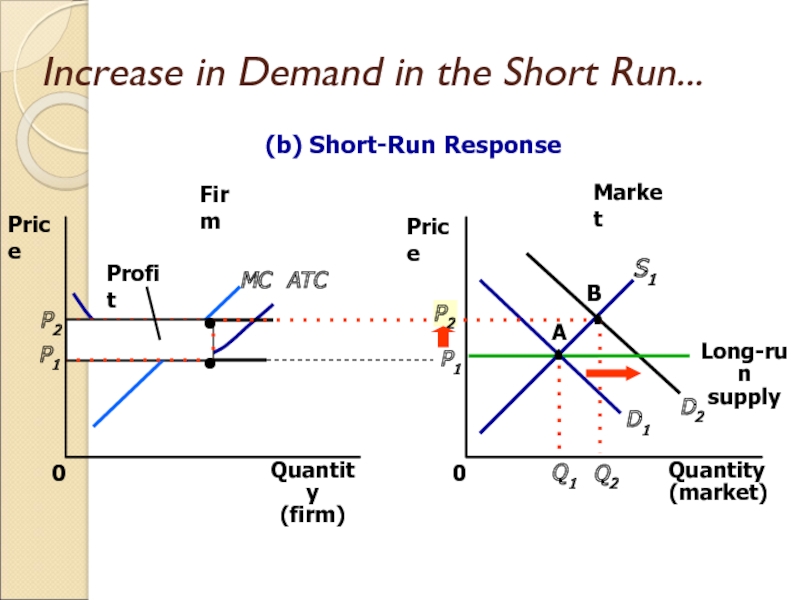
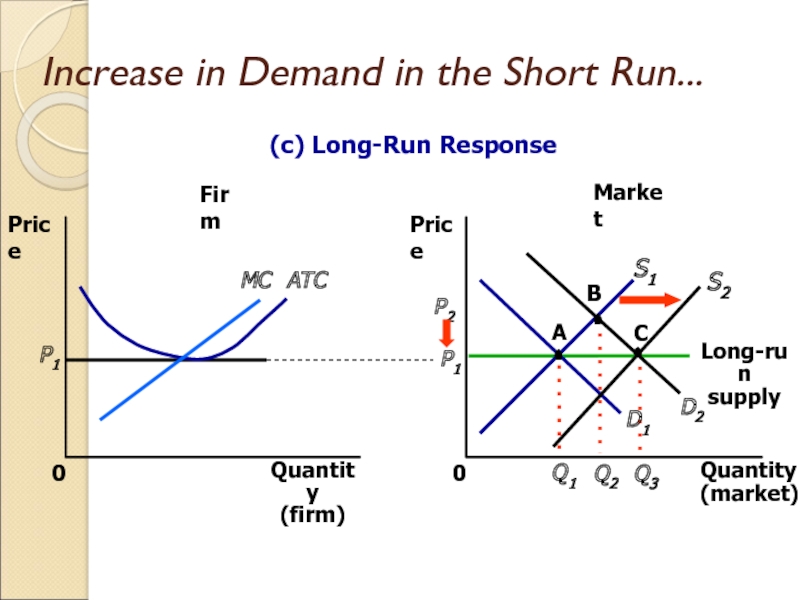
Слайд 28Increase in Demand in the Short Run
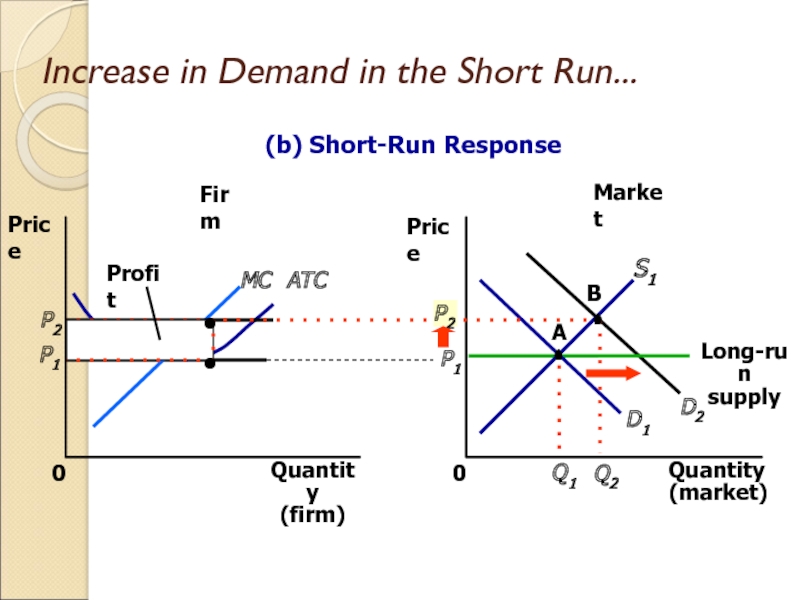
An increase in demand
raises price and quantity in the short run.
Firms earn profits
because price now exceeds average total cost.
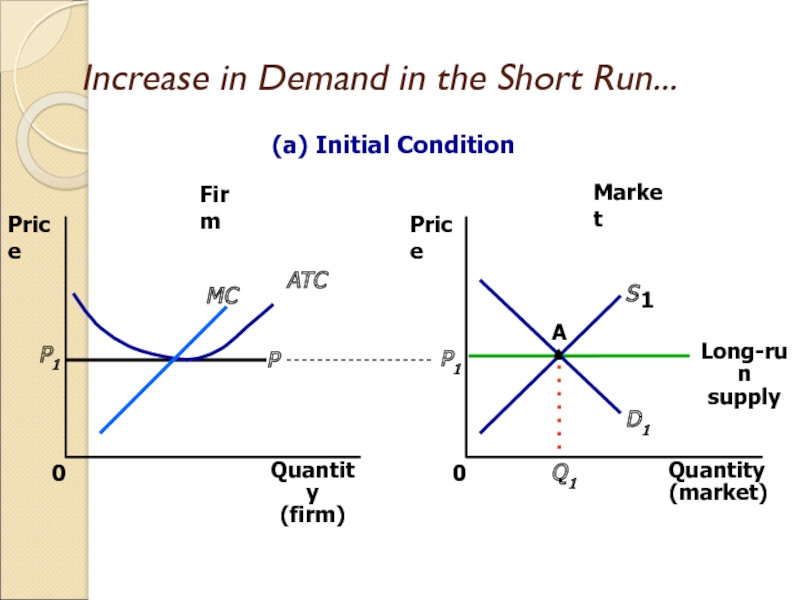
Слайд 29Increase in Demand in the Short Run...
Market
Firm
Quantity
(firm)
0
Price
MC
ATC
P1
Quantity
(market)
Price
0
D1
P1
Q1
A
S
1
Long-run
supply
(a) Initial Condition
P
Слайд 30Increase in Demand in the Short Run...
Market
Firm
Quantity
(firm)
0
Price
MC
ATC
P1
Quantity
(market)
Price
0
D1
P1
Q1
A
S1
Long-run
supply
(b) Short-Run Response
Слайд 31Increase in Demand in the Short Run...
Market
Firm
Quantity
(firm)
0
Price
MC
ATC
P1
Quantity
(market)
Price
0
D1
P1
Q1
A
S1
Long-run
supply
(c) Long-Run Response
D2
B
Q2
P2
S2
C
Q3
Слайд 32Why the Long-Run Supply Curve Might Slope Upward
Some resources used
in production may be available only in limited quantities.
Firms may
have different costs.
Слайд 33Marginal Firm
The marginal firm is the firm that would exit
the market if the price were any lower.
Слайд 34Summary
Because a competitive firm is a price taker, its revenue
is proportional to the amount of output it produces.
The price
of the good equals both the firm’s average revenue and its marginal revenue.
Слайд 35Summary
To maximize profit a firm chooses the quantity of output
such that marginal revenue equals marginal cost.
This is also
the quantity at which price equals marginal cost.
Therefore, the firm’s marginal cost curve is its supply curve.
Слайд 36Summary
In the short run when a firm cannot recover its
fixed costs, the firm will choose to shut down temporarily
if the price of the good is less than average variable cost.
In the long run when the firm can recover both fixed and variable costs, it will choose to exit if the price is less than average total cost.
Слайд 37Summary
In a market with free entry and exit, profits are
driven to zero in the long run and all firms
produce at the efficient scale.
Changes in demand have different effects over different time horizons.
Слайд 39Profit Maximization for the Competitive Firm...
Harcourt, Inc. items and derived
items copyright © 2001 by Harcourt, Inc.
Слайд 40The Marginal-Cost Curve and the Firm’s Supply Decision...
Harcourt, Inc. items
and derived items copyright © 2001 by Harcourt, Inc.
Слайд 41The Firm’s Short-Run Decision to Shut Down...
Слайд 42The Competitive Firm’s Long-Run Supply Curve...
Слайд 43The Competitive Firm’s Long-Run Supply Curve...
Слайд 44Measuring Profit in the Graph for the Competitive Firm...
Слайд 45Measuring Profit in the Graph for the Competitive Firm...
Слайд 46The Short Run: Market Supply with a Fixed Number of
Firms...
Слайд 47The Long Run: Market Supply with Entry and Exit...
Слайд 48Increase in Demand in the Short Run...
Слайд 49Increase in Demand in the Short Run...
Слайд 50Increase in Demand in the Short Run...
